The Interpolated algorithm calculates a value that is:
- Equal to or higher than the last raw historic value before the start of the sample. For the purposes of this section, we will refer to the last raw historic value before the start of the sample as the ‘last pre-sample’ historic value.
and:
- Equal to or lower than the next raw historic value after the ‘last pre-sample’ historic value. The ‘next’ value may be in the sample or could be after the sample. If there is no ‘next’ raw historic value, the interpolated value will be exactly the same as the ‘last pre-sample’ value.
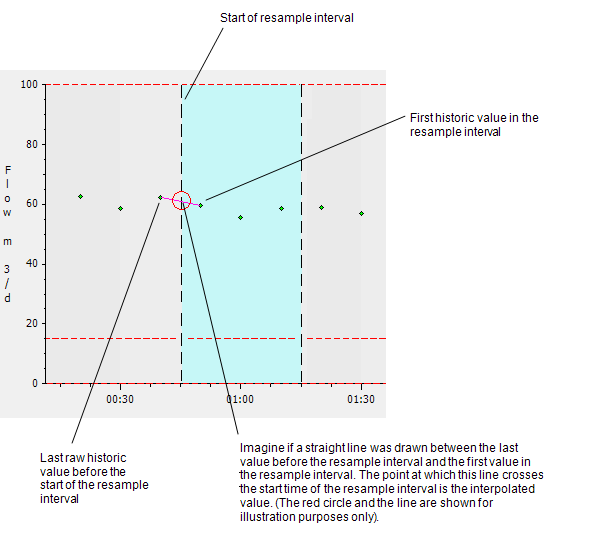
To perform the interpolated calculation, ClearSCADA takes the ‘last pre-sample’ calculation and the ‘next’ raw historic value after that, and creates an estimated value that is between the two. This calculation is the equivalent of ClearSCADA drawing a line between the ‘last pre-sample’ value and the ‘next’ raw historic value on a trace, with the result being the point where the start of the sample crosses that line.

Interpolated values are useful when there are known gaps in the data. This is because ClearSCADA uses a value outside of the sample in its interpolated calculation, and so it can still return a result, even if there are no raw historic values in the sample (in this case, ClearSCADA returns the last raw historic value from before the sample as the integrated value).
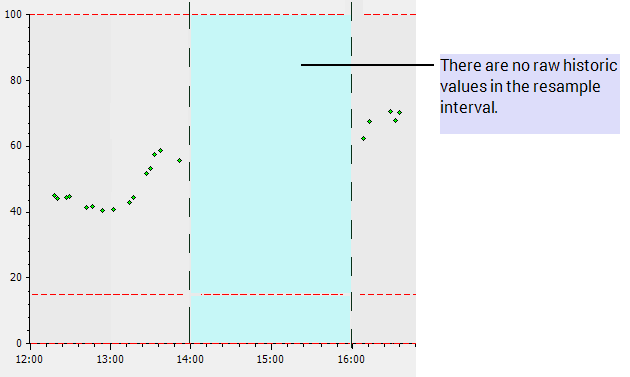
A Trend is configured to show a raw historic trace, and the X-Axis shows 12 hours,starting at 12:00, with markers for each hour.There are raw historic values for the hours 12:00 to 14:00 and 16:00 to 18:00, but there are no raw historic values for the hours 14:00 to 16:00.

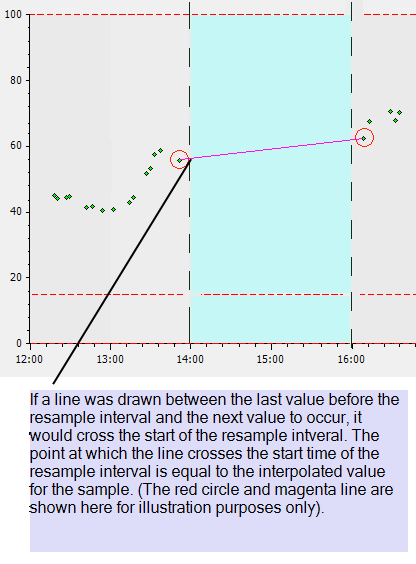
To calculate the integrated value for the sample, ClearSCADA uses the last value before the start of the sample and the next value after that. In this case, the next value is the first value after the end of the sample. It then calculates the interpolated value, which corresponds to the point at the start of the sample where a line between the ‘last pre-sample’ value and the next value would meet.
