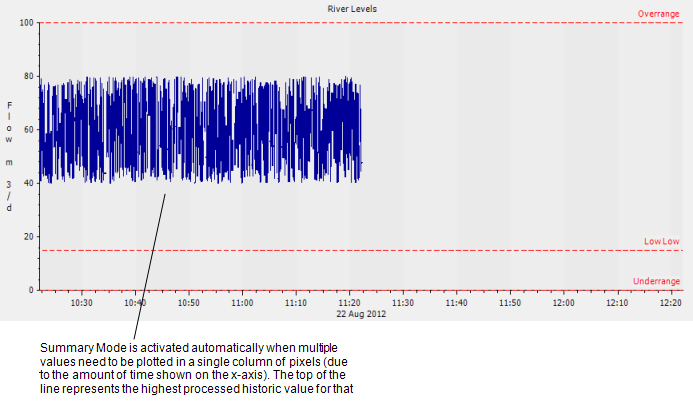
For processed historic traces, ClearSCADA calculates each value according to the defined (resample) Interval for the trace. The results of the calculations are then plotted on the trace. When each pixel of the Trend display represents less time than the resample Interval, the trace is displayed in ‘normal’ mode and is drawn as a line, bar or step.
If each column of pixels represents a time greater than the resample interval for a trace, ClearSCADA switches the trace to ‘Summary Mode’ automatically. This is to help avoid slow performance, which can sometimes occur when drawing multiple values in the same pixel.
When a processed historic trace is shown in Summary Mode, each column of pixels represents an amount of time, and ClearSCADA has to draw multiple values for that time period. To help avoid slow performance when drawing multiple values in the same pixel, ClearSCADA draws a vertical line that represents the range of historic processed values that were calculated (for the time represented by 1 column of pixels). The top of the line represents the highest processed historic value calculated and the bottom of the line represents the lowest.

Example:
A trace is configured to represent the historic values of a point. The trace has a resample interval of 1M (1 minute).
The Trend on which the trace is shown has an X-axis representing a large period of time, meaning that each column of pixels represents more than 1 minute. Let’s say that each column of pixels represents 10M. This means that for each column of pixels, there will be 10 values (as the processed historic values are calculated every minute, but a single column of pixels represents 10 minutes).
Every minute, ClearSCADA has to draw a processed historic value. As each column of pixels represents 10 minutes, this means ClearSCADA would have to draw 10 values in each column. This is possible if each of the values are unique, as each value can be drawn as a single pixel in the column, but if one or more values are the same, ClearSCADA would have to draw a value in a pixel and then draw over it with another value. To avoid this, ClearSCADA switches the trace to Summary Mode.
With the trace in Summary Mode, ClearSCADA draws a vertical line for each column of pixels. In a ten minute period, the point’s processed historic values are 20, 20, 22, 21, 21, 21, 23, 24, 24, 28. ClearSCADA represents these values on the Trend by drawing a vertical line that is 1 pixel wide (the column of pixels represents the 10 minute period) and the bottom of the line is at 20 and the top of the line is at 28.