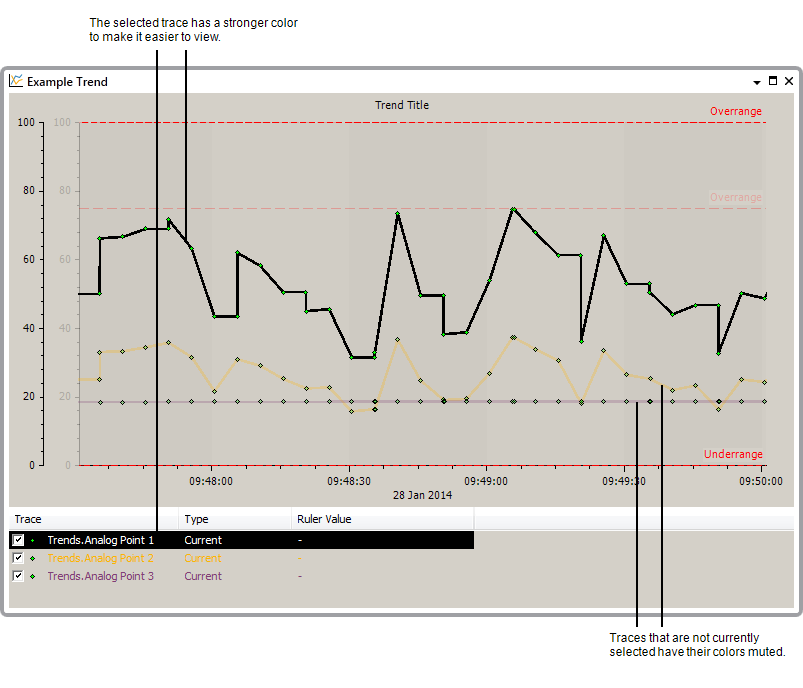
The Trace is a line that represents a point’s values over a period of time. You can configure a Trend to display one or more traces simultaneously.

The values that are represented by the trace are indicated by Trend Markers, and these are joined by the trace line. When you first add a trace to a Trend, ClearSCADA chooses a color automatically. To make the Trend as easy to use as possible, ClearSCADA will detect the color of the background and then choose one of 22 colors. (The 22 colors used are based on the results of Kenneth L Kelly's color research). However, these colors are only applied when you first create a trace.
If your User Account has the Configure permission, you can configure the trace to have a different source (the point that provides the values that are plotted on the Trend). You can also change the appearance of a trace, including its color, line style, and type of trace markers(see Configure a Trace).
There are two types of trace:
- Current Trace—Represents the current value of a point. A trace can be configured as a current trace for any database point. When a current trace is displayed, the trace is continually updated in the Trend display with the current value of the point.
As the trace is continuously updated, more and more values are plotted on the Trend. Over time, this will cause the Trend to scroll into the next interval as it is set to display the latest values. By using the Previous Interval tool or the Pan tool, you can set the Trend to display earlier values (you can view any of the values that have been plotted since you displayed the Trend). As the trace only represents current data, you cannot view values that were recorded before the Trend was displayed.
When you close the Trend, the current trace data is discarded and cannot be re-displayed on the Trend.
- Historic Trace—Represents the historic value of a point. Historic traces are only available for those database points that have historic logging enabled in their configuration.
Historic traces show the values that have been stored historically for the point (have been stored in the historic database). Unlike with current traces, historic traces allow you to scroll backwards to earlier values that were recorded before the Trace was displayed. By using the Pan tool or Previous Interval tool, you can view any of the point’s historic values on the Trend.
Pre-Configured Trends and ‘Custom’ Ad Hoc Trends are capable of displaying current and historic traces simultaneously. ‘Standard’ Ad Hoc Trends can only display current traces or historic traces—they cannot display both simultaneously.
When you view a Trend that has multiple traces, one of the traces will appear with more clarity than the others. This is because ClearSCADA has a 'focus' feature which is designed to help improve your Trend viewing experience.By showing the currently selected trace in more clarity than the other traces, ClearSCADA makes it easier to see the data on the Trend. This is particularly useful with Trends that contain several traces that have a high quantity of values.

To change the focus, select one of the other Trends in the Key. The color of the selected trace will gradually become stronger and the other traces will appear to be faded out. The same effect is applied to the Y-Axes and Alarm Limits (those that apply to the selected trace are shown normally, whereas any other Y-Axes and Alarm Limits are faded out), see Define the Default Settings for New Trends.
When viewing a Trend, you can use the Hide Trace feature to remove one or more traces from view (see Hide and Show a Trace). This is useful when there are multiple traces on the Trend and the amount of data on display makes it difficult to use the Trend .
Further Information