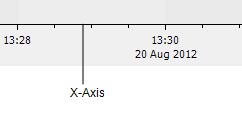
The X-Axis is displayed at the bottom of the Trend by default. It represents an interval—the amount of time that can be shown on the Trend at once. For example, if a Trend has an X-Axis that represents one hour, the Trend can only show one-hour’s worth of data on a single display.

If you magnify the Trend (zoom in or out), you change the X-Axis interval so that it shows a smaller or greater amount of time.After zooming in or out, you can revert the Trend to the default setting for the X-Axis by using the Revert to Defaults feature (see Display the Default Time Scale on a Trend). The default setting for the Trend is the X-Axis interval that is saved for the Trend.
You can also alter the settings for the X-Axis (see Configure the X-Axis). To do this, your user account has to have the Configure permission.