You can change an X-Y-Z Plot's background color and the mode in which data is shown on the plot. You do this using fields in the X-Y-Z Plot Properties window (see Change the Appearance of an X-Y-Z Plot).
Use the Miscellaneous section of the window to specify these properties:

- Background Color:Use the Background Color button to specify the color of the X-Y-Z Plot's background. You can select a color from the Color Palette or select the ... option to display the Color window. You can use the Color window to create a custom color (see The Color Palette Window in the ClearSCADA Guide to Core Configuration).
- Drawing Mode:Use this combo box to specify how the relationship between the traces' data values is represented on the plot. Choose from:
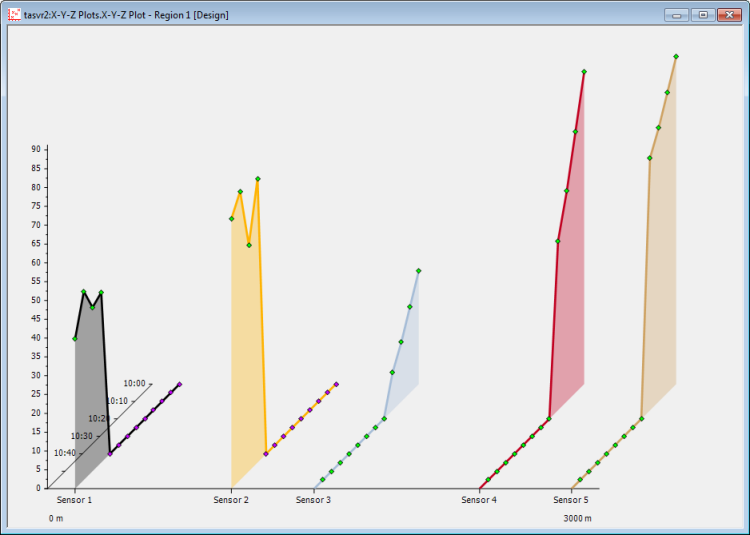
- Connect by Point: ClearSCADA draws a line between the values on an individual trace.
With this drawing mode, you use the Trace Properties window to define properties such as the traces' line color and marker style (see Configure the Line and Marker Properties when in 'Connect by Point' Mode)
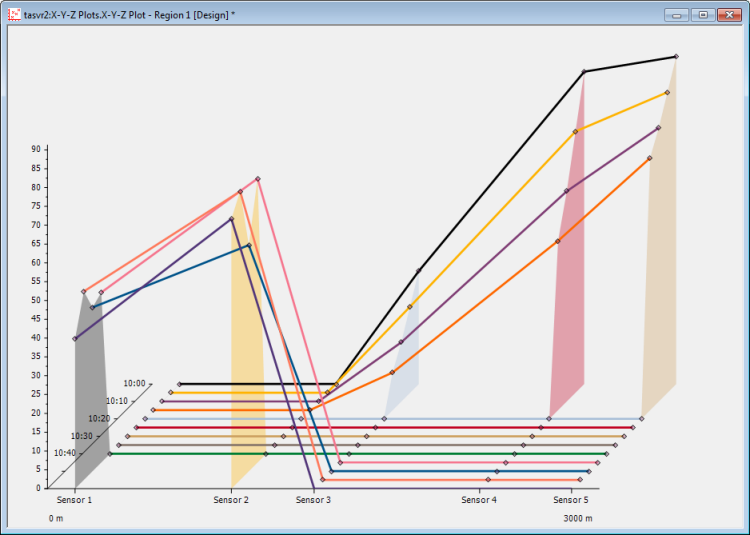
- Connect by Timestamp:ClearSCADA draws a line between each of the data values that have the same time stamp. This drawing mode is useful for determining how data readings differ between data sources at a particular time.
With this drawing mode, you use the X-Y-Z Plot Properties window to define properties such as the traces' marker style (see Configure the Line and Marker Properties when in 'Connect by Timestamp' or 'Connect by Point and Timestamp' Mode). With this mode, ClearSCADA sets the Line color automatically, from a hard-coded pre-defined set of colors. This automatic selection is designed to help provide colors that contrast well with the X-Y-Z Plot's Background Color.
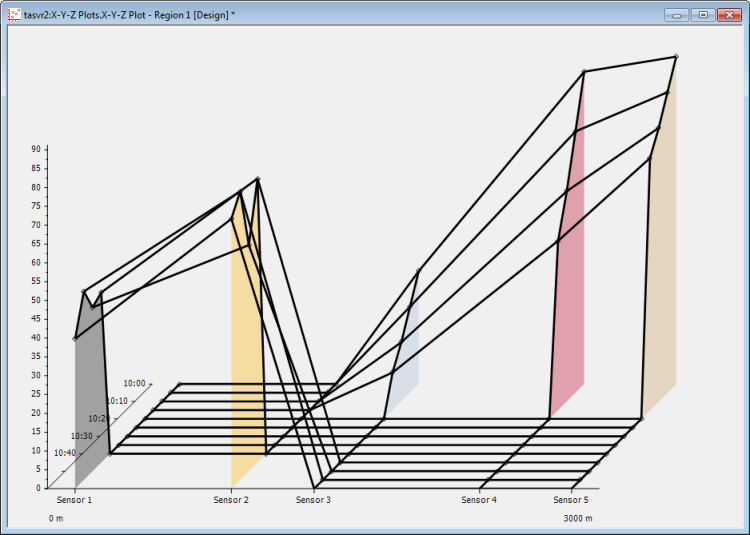
- Connect by Point and Timestamp:ClearSCADA draws a line between the values on each trace; additionally, it also draws a line between data values that have the same time stamp.
With this drawing mode, you use the X-Y-Z Plot Properties window to define properties such as the traces' marker style (see Configure the Line and Marker Properties when in 'Connect by Timestamp' or 'Connect by Point and Timestamp' Mode). With this mode, the Line properties, including the Color, apply to the lines that ClearSCADA draws between both the trace values and values that have the same time stamps.
- Connect by Point: ClearSCADA draws a line between the values on an individual trace.
An X-Y-Z Plot showing data in 'Connect by Point' mode:

The same data shown in 'Connect by Timestamp' mode:

The same data shown in 'Connect by Point and Timestamp' mode:
