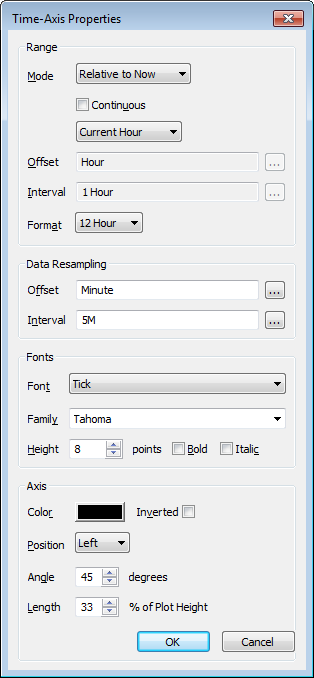
When you create a new X-Y-Z Plot, ClearSCADA applies the default settings that are defined in the Options window (see Define the Default Settings for New X-Y-Z Plots). You can change the settings for an individual X-Y-Z Plot so that they differ from the default X-Y-Z Plot settings. This is useful when you want an X-Y-Z Plot to use, for example, different colors or fonts.
To change the Time axis settings on an individual X-Y-Z Plot:
- Display the X-Y-Z Plot in Design mode (see Display an X-Y-Z Plot in Design Mode).
- Either:
- Double-click on the Time axis.
Or:
- Right-click on the Time axis.
A context-sensitive menu is displayed. - Select the Time Axis Properties option.
The Time Axis Properties window is displayed.

- Use the window to:
- Select the Save button to store the changes to the X-Y-Z Plot.