You can specify the range that the x-axis represents. This is useful if an X-Y-Z Plot represents, for example, a length of pipe, with traces showing various sensor readings taken along the length of pipe. With such an X-Y-Z Plot, you might want to include range labels to indicate the positions a t which the readings are taken along the pipe.
UNEXPECTED BEHAVIOR OF APPLICATION
We recommend that you set the Range limits for an X-Y-Z Plot's x-axis before you add traces to the Plot ((see Configure the Axis Range). ClearSCADA takes the limits into account when it calculates the positions at which it places traces along the x-axis. If you change the x-axis range after you add traces to the X-Y-Z Plot, the traces will appear to 'move' along the x-axis in relation to the range change, to retain their existing position. If you reduce the x-axis range so that it no longer accommodates a trace, you can use the Zoom In or Out feature to view the trace.
You specify the x-axis range using fields in the X-Axis Properties window (see Configure the X-Axis Properties).
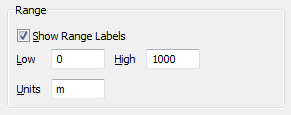
Use the Range section of the window to specify the range settings:

- Show Range Labels: Select this check box to display range labels alongside the x-axis by default.
Clear the check box to hide the range labels by default. Regardless of the setting of the Show Range Labels check box, you still need to specify the relevant range (using the fields below). This is because users can use context-sensitive menu options to show and hide the axis range labels as required (see Show or Hide the Range Labels).
- Low: Specify the lowest value of the x-axis range. You can specify a negative number if required.
- High: Specify the highest value of the x-axis range. Range values are stored as IEEE double-precision (64-bit) floating point numbers.
- Units: Specify the units that are used for the x-axis's range. Clear the field if no units are required.