A Dynagraph can include the following elements:
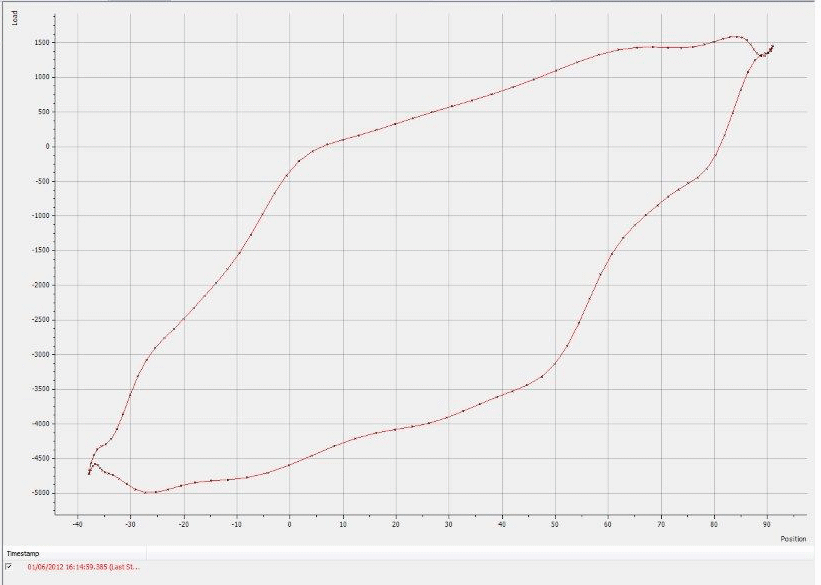
The horizontal axis that indicates the position of the pump in the well.
The vertical axis that indicates the loading on the pump.
The area at the bottom of the display that provides information about the data being shown (see Understand the Dynagraph's Key).
Small symbols (the shape of a cross, diamond, or square) that can be shown on the Dynagraph. Each marker represents an individual data reading, indicating the rod pump loading at a particular position in the well.
The lines that connect the markers together, to visually indicate the difference between the data readings.
The text than can be shown at the top of the Dynagraph, to provide users with information about the Dynagraph’s content.