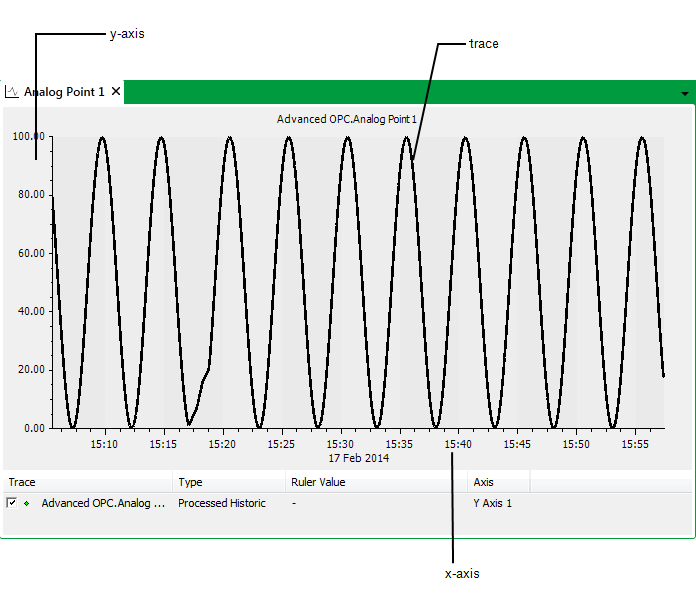
You can display the trend, or movement, of a Forecast’s values in the form of a Trend. (A Trend is a type of graph used to compare values over time).
Each Trend consists of an x-axis, a y-axis, and a trace. The x-axis displays a time interval, and the y-axis displays the measurement units. The Trace represents the Forecast values.

Once Forecast data has been imported into a Forecast object, you can view the data as a Trend by using the Display <Trace Name> Trend pick action, available from the Forecast object. (The pick action only becomes available once data exists for a Forecast object.)
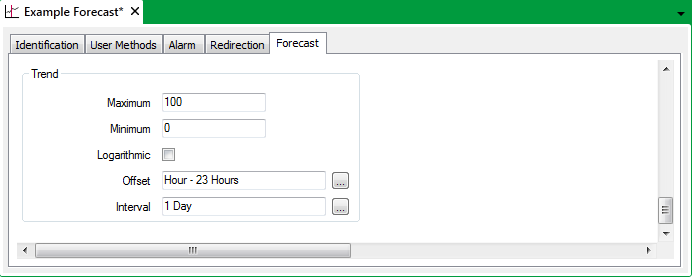
Use the fields within the Trend section of the Forecast tab to define the settings for when the data is displayed as a Trend:

- Maximum—Use to specify the highest value to be shown on the y-axis.
- Minimum—Use to specify the lowest value to be shown on the y-axis.
- Logarithmic—Use this check box to define whether the y-axis is logarithmic or linear.
Select the Logarithmic check box if you want the y-axis to have a logarithmic scale.
Clear the Logarithmic check box if you want the y-axis to have a linear scale.
- Offset—Specify the default start time for the x-axis, in relation to the present time.
Enter the required offset in the OPC Relative Time Format. You can enter the value directly in the field, or use the Offset window (accessed via the field's browse button) to specify the required value. For example, enter H - 23H for the earliest time on the x-axis to be 23 hours before the beginning of the current hour.
- Interval—Specify the default time interval for the x-axis, starting from the time specified in the Offset field.
Enter the required interval in the OPC Time Format. You can enter the value directly in the field, or use the Interval window (accessed via the field's browse button) to specify the required value. For example, enter 1D for the x-axis to display a one-day period.