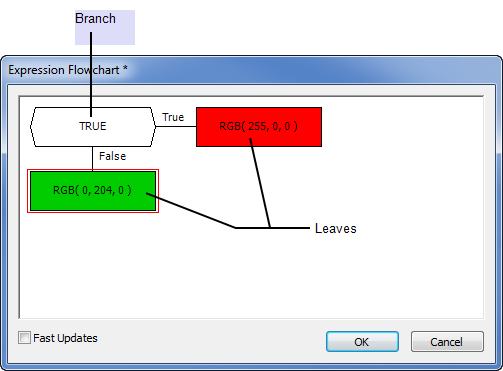
The Expression Flowchart window allows you to create IIF expressions for Mimics, Data Grids, and Data Sets in a diagram format. This format makes it easier to create complicated IIF expressions as you can easily visualize what happens with each condition.
For information on IIF expressions, see IIF.
Each flowchart consists of branches and leaves. Branches contain boolean expressions, and the result of these expressions is True or False. There are 2 leaves for each branch. Each leaf represents a True result or a False result.
When Geo SCADA Expert processes the flowchart, it begins with the first branch (the top-left branch) and proceeds through the flowchart until it reaches a leaf. The value in the leaf is used as the value of the expression.
Example:
The following flowchart is used with the FillColour animation property of a polygon on a Mimic.

The branch expression tests whether the value of a digital point's alarm state is 4 (the point has an unacknowledged uncleared alarm).
The True leaf sets the color to be red and the False leaf sets the color to be green. This means that if the digital point has an uncleared alarm, the FillColour animation will have RGB (255, 0, 0) as its value (red) and if the digital point does not have an uncleared alarm, the FillColour animation will have RGB(0, 255, 0) as its value (green).