The 1hAverage algorithm produces an average value based on the good quality raw historic values reported for an hour period. The timestamp for each processed historic value produced by the 1hAverage algorithm is at the start of the resample interval.
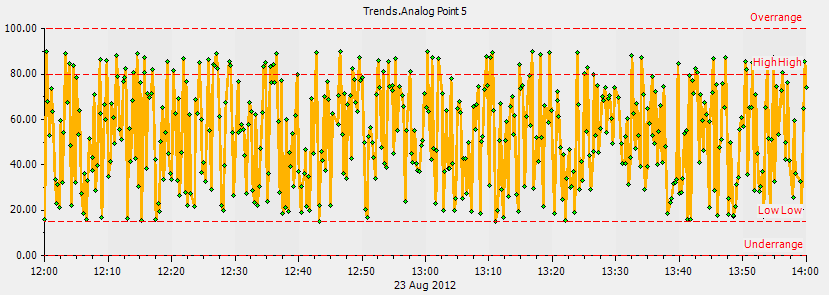
For example, the following Trend shows a point’s raw historic values for the period 12:00-14:00

By creating a processed historic trace for the point, and applying the 1hAverage algorithm, Geo SCADA Expert can create the following trace for the same time period. The Interval of the trace is configured to be 30M, which means that Geo SCADA Expert calculates the average hourly value at 30 minute intervals (samples) on the X-Axis. The result of each calculation is plotted on the trace at the start of each sample.

So in this example, the average hourly value at 12:30 is calculated using each of the raw historic values for the period 12:30-13:00. The average hourly value for 13:00 is calculated using the raw historic values for the period 13:00-13:30 and so on.
To provide the result of the 1hAverage algorithm, Geo SCADA Expert adds up each of the raw historic values in the hour period. It then divides the total by the quantity of raw historic values in the hour period. The result is plotted on the trace at the start time of the sample.