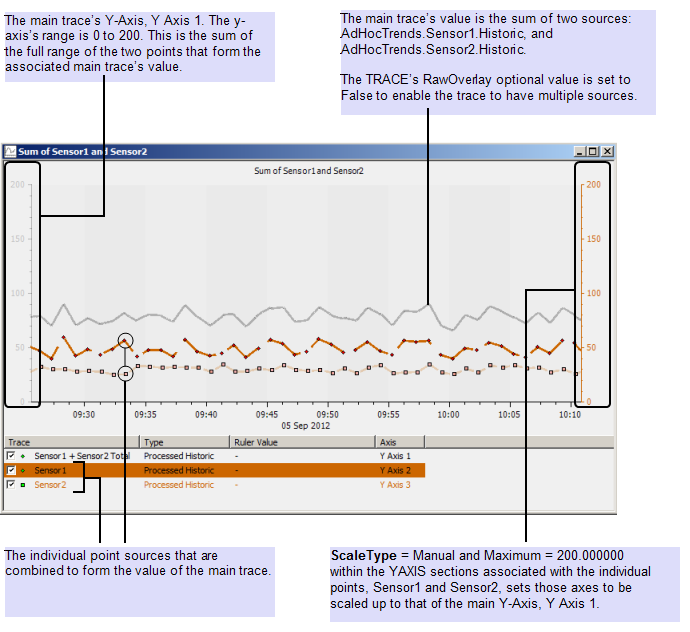
This example demonstrates how you can use TrendSpec to define a trace that has more than one origin.
Example:
A TrendSpec definition is used to produce an ad hoc Trend with a main trace that has multiple sources—the trace’s value is the sum of two point values. The Trend also includes the traces of the individual source points, for comparison with the main trace. For the purpose of this example, the TrendSpec definition is entered as the URL for a hyperlink pick action on a Mimic. The 'SCX:////TREND' prefix is required for the URL, but technically, this is not part of the TrendSpec definition.
SCX:////TREND/TREND(
TRACE(PROCESSEDHISTORIC,'Y Axis 1', Label = 'Sensor1 + Sensor2 Total',
SOURCE('AdHocTrends.Sensor1.Historic'),
SOURCE('AdHocTrends.Sensor2.Historic'),
RawOverlay = False, LineStyle = DASHSOLID),
TRACE(PROCESSEDHISTORIC,'Y Axis 2', Label = 'Sensor1',
SOURCE('AdHocTrends.Sensor1.Historic'),
RawOverlay = True, LineColour = RGB(204,102,0),LineStyle = DASHDASH),
TRACE(PROCESSEDHISTORIC, 'Y Axis 3', Label = 'Sensor2',
SOURCE('AdHocTrends.Sensor2.Historic'),
RawOverlay = True, LineColour = RGB(204,102,0),
LineStyle = DASHDOT, MarkerStyle = Square),
XAXIS(RELATIVENOW, Interval = '24H'),
YAXIS('Y Axis 1'),
YAXIS('Y Axis 2', ScaleType = Manual,Maximum = 200.000000,
Position = Right, Colour = RGB(204,102,0)),
YAXIS('Y Axis 3', ScaleType = Manual, Maximum = 200.000000, Visible = False),
Title = 'Sum of Sensor1 and Sensor2')
In the above definition, the main trace, which is defined first, has two sources. These are specified by the lines:
SOURCE('AdHocTrends.Sensor1.Historic'),
SOURCE('AdHocTrends.Sensor2.Historic')
The main trace’s RawOverlay optional value is set to False to enable the trace to have multiple sources.
The TRACE and YAXIS sections for the individual points, Sensor1 and Sensor 2, are assigned the optional values
LineColour = RGB(204,102,0)
and
Colour = RGB(204,102,0)
to set those traces, labels, and y-axes to appear in brown.
As the TrendSpec definition does not specify otherwise, Geo SCADA Expert automatically assigns a range to the main trace’s y-axis, Y Axis 1. The range is the sum of the full range of the two points that form the associated main trace’s value. As the points each have a range of 0 to 100, Geo SCADA Expert assigns Y Axis 1 the range 0 to 200.
The YAXIS sections for the individual points Sensor 1 and Sensor 2 are assigned the optional values
ScaleType = Manual, Maximum = 200.000000
to scale the axes up to that of the main y-axis, Y Axis 1.
As Y Axis 2 and Y Axis 3 are identical, Y Axis 3 is omitted from the Trend window. This is achieved by including the YAXIS optional value
Visible = False
This results in an ad hoc Trend that has these properties:

Further Information