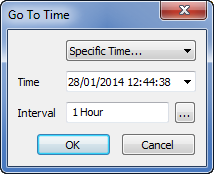
You can use the Go To Time feature to display a specific time on a Trend. For example, you can choose to display the current minute—this causes the x-axis to change so that it only represents one minute (the current minute).
The Go To Time feature can display a variety of times including:
- This Week
- Previous Minute
- Relative Time
- Specific Time.
To use the Go To Time feature to display a preset period of Trend data:
- Display a Trend in Run Mode.
- Right-click on the x-axis.
A context-sensitive menu is displayed. -
Select the Go To Time option.
The Go To Time window is displayed.
- Use the combo box at the top of the Go To Time window to select one of the following options:
- Current Minute—The x-axis will represent the start of the current minute to the end of the current minute
- Previous Minute—The x-axis will represent the start of the previous minute to the end of the previous minute
- Current Hour—The x-axis will represent the start of the current hour to the end of the current hour
- Previous Hour—The x-axis will represent the start of the previous hour to the end of the previous hour
- Today—The x-axis will represent the start of the current day to the end of the current day
- Yesterday—The x-axis will represent the start of the previous day to the end of the previous day
- This Week—The x-axis will represent the start of the current week to the end of the current week
- Last Week—The x-axis will represent the start of the previous week to the end of the previous week
- This Month—The x-axis will represent the start of the current month to the end of the current month
- Last Month—The x-axis will represent the start of the previous month to the end of the previous month
- This Year—The x-axis will represent the start of the current year to the end of the current year
- Last Year—The x-axis will represent the start of the previous year to the end of the previous year
- Relative Time—The x-axis will represent a period of time that begins and ends at a time that is relative to the current time. When you select this option, you need to enter an Offset and an Interval (see step 5)
- Specific Time—The x-axis will represent a specific time period. When you select this option, you need to enter a Time and Interval (see step 6).
If you have selected a predefined amount of time, the other fields on the Go To Time window are grayed out. Proceed to step 7.
If you selected the Relative Time option, proceed to step 5.
If you selected the Specific Time option, proceed to step 6.
- Define the Offset and Interval for the Relative Time:
- Use the Offset field to define the start time for the Trend. Enter the required offset in the OPC Relative Time Format. You can enter the value directly in the field, or use the Offset window (accessed via the field's browse button) to specify the required value.
- Use the Interval field to define the total amount of time to be shown on the x-axis. Enter the required interval in the OPC Time Format. You can enter the value directly in the field, or use the Interval window (accessed via the field's browse button) to specify the required value.
You can only specify an interval that begins after the offset start time.
- Proceed to step 7.
- Define the Time and Interval for the Specific Time:
- Use the Time combo box to select a specific date and time. For information on specifying a different date or time to that shown, see Specifying the Required Entry in a Date and Time Field in the Geo SCADA Expert Guide to Core Configuration..
- Use the Interval field to define the total amount of time to be shown on the x-axis. Enter the required interval in the OPC Time Format. You can enter the value directly in the field, or use the Interval window (accessed via the field's browse button) to specify the required value.
You can only specify an interval that begins after the start time.
- Select the OK button.
The Go To Time window is closed and the Trend is displayed. The Trend shows the data for the time period you defined.