X-Y-Z Plots are special types of Trends that allow you to monitor the relationships between multiple sets of historic values. The configuration of each X-Y-Z Plot provides a 'three-dimensional' ('3D') graphical representation of sets of historic values, with the z-axis providing the 'depth', in the form of a time line.
Each X-Y-Z Plot consists of:
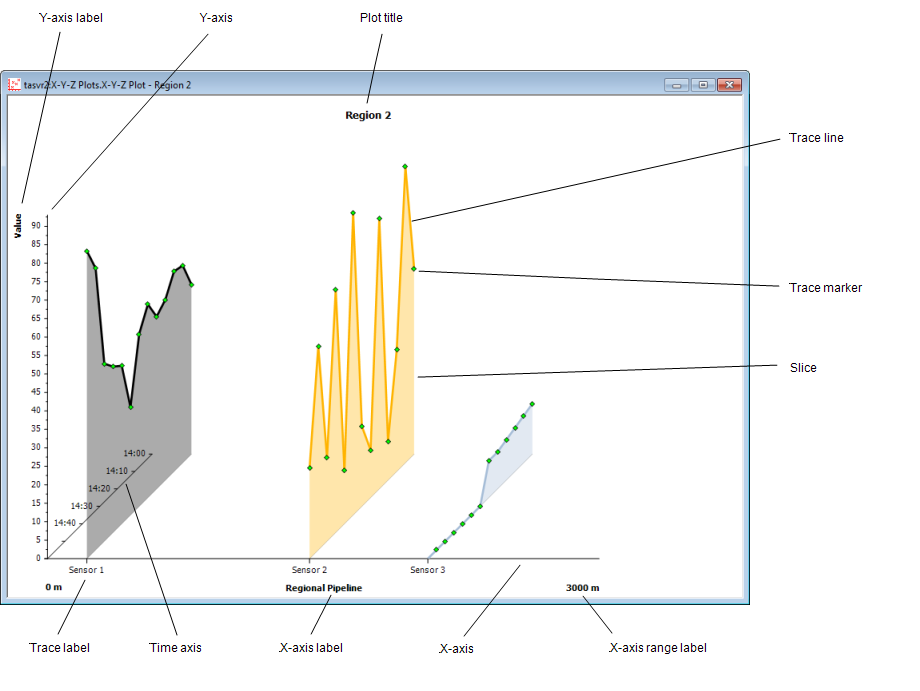
- X-Axis: This axis indicates the data sources for which traces are included on the X-Y-Z Plot. The data sources are typically points in the database.
- Y-Axis: This axis indicates the range of data values shown on the X-Y-Z Plot.
- Time Axis: This axis represents the amount of time shown on the X-Y-Z Plot.
- Trace: Each trace comprises a collection of historic values that have been obtained from a data source. You can include multiple traces on an X-Y-Z Plot. The plot's 'Drawing Mode' determines the connection lines that Geo SCADA Expert draws between the data values on the X-Y-Z Plot (see below).
- Markers: Indicators that represent the individual data values. On an X-Y-Z Plot, the markers indicate processed historic data values. These are values that Geo SCADA Expert has calculated by performing the required calculation ('algorithm') on the data source's raw historic values.
- Slice: The space between the trace's values and the start of the y-axis. You can assign a color and transparency level to each trace's slice.
The data on an X-Y-Z Plot can be displayed in one of three drawing modes. The drawing mode determines the connection lines that Geo SCADA Expert draws between the data values on the X-Y-Z Plot:
- Connect by Point: Geo SCADA Expert draws a line between the values on an individual trace.
- Connect by Timestamp: Geo SCADA Expert draws a line between the data values that have the same time stamp.
- Connect by Point and Timestamp: Geo SCADA Expert draws a line between the values on each trace; additionally, it also draws a line between data values that have the same time stamp.
Examples:
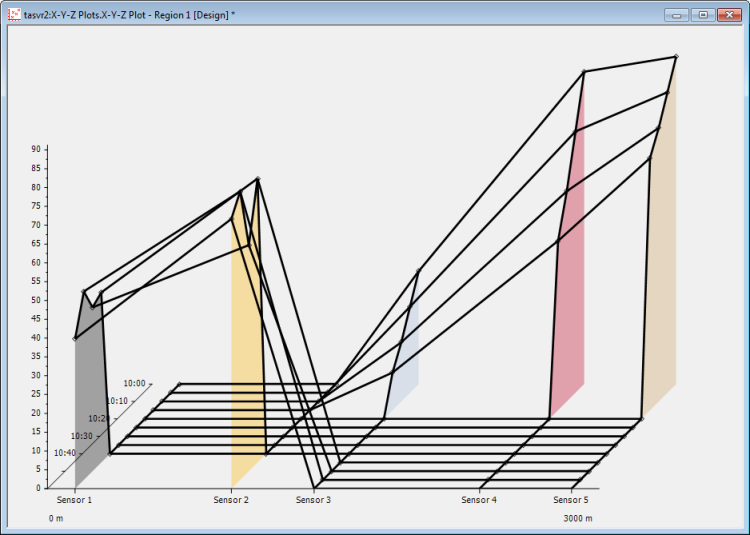
An X-Y-Z Plot showing data in 'Connect by Point' mode:
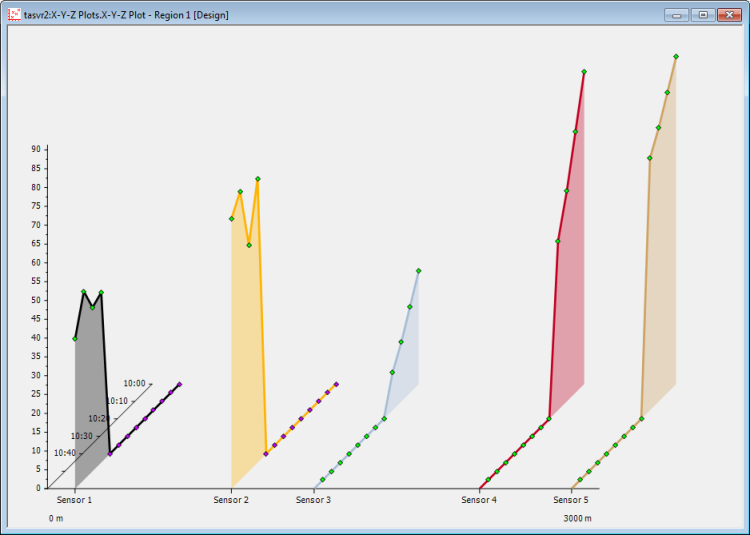
The same data shown in 'Connect by Timestamp' mode:
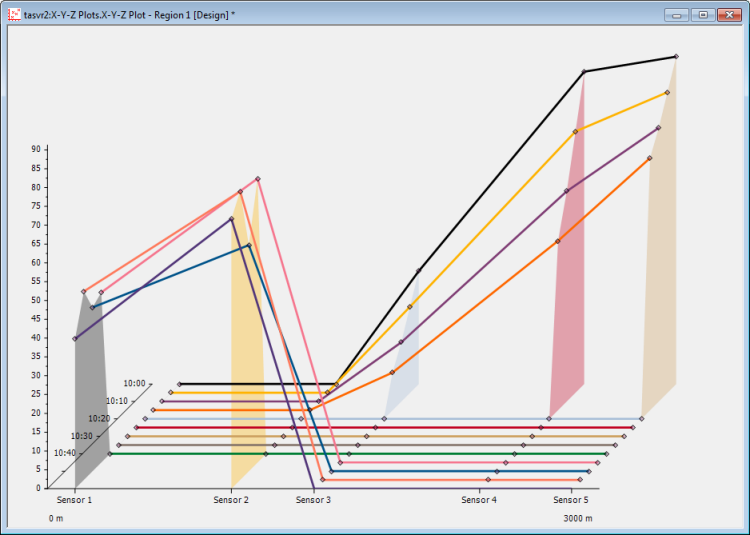
The same data shown in 'Connect by Point and Timestamp' mode: