The Historian category provides status information about the historic data that is being stored. The status information is useful for identifying which points, if any, are logging excess data.

The status for the historic data is categorized as:
Indicates the type of historic data. The Id can be:
- Event—Geo SCADA Expert events that are stored in the Event Journal.
- ConfigChanges—Historic data created as a record of configuration changes.
- Raw—Historic data that has been received from points.
- Modified—Historic data that has been modified by operators or engineers.
- Annotation—Annotations that have been inserted by operators or engineers.
- Suppression—Historic data that relates to suppressed alarms. A historic record is created whenever alarms are suppressed on a point (and also when alarms stop being suppressed on a point). For more information on alarm suppression, see Alarm Suppression.
The number of errors per region of historic data. This should be 0. If your system has a number other than 0, this indicates abnormal conditions and you should contact Schneider Electric for assistance.
The total amount of memory used to store the records and database information.
The size (in bytes) of a single record.
The number of streams used to transfer the directories for historic data. When the historic data is transferred, it is separated into directories. Each directory requires approximately 1 stream.
The total number of files that are on disk and represent the time period defined for the primary historic granule index. There is 1 file per granule (a period of time, for example, a week). If the Index after n weeks feature is not being used, the Total Primary File entry is the total number of historic files on disk (see Manage the Size of the Primary Index).
The total number of files that are on disk and represent the time period defined for the secondary historic granule index. The entry is 0 if the Index after n weeks feature is disabled (see Manage the Size of the Primary Index).
The total number of historic records that are stored on the hard disk. If this number increases rapidly, there may be a high server load (see Check for High Load on a Geo SCADA Expert server).
The total size of the historic data.
The percentage of historic data that has not yet been saved to the hard disk.
The number of historic records that have not yet been saved to the hard disk.
Indicates the size of the data that has not yet been saved to the hard disk.
The number of file read operations.
The number of file write operations.
The percentage of historic data that is stored in the cache. The cache is used to store data that is required by a historic display that is currently in use. For example, if the Events List for a specific item is displayed, the cache is used to store all of the historic data that could be shown on the Events List for that item.
The number of historic records that are stored in the cache (see Define the Historic Data Cache Size).
The size of the historic data that is stored in the cache (see Define the Historic Data Cache Size).
The number of historic files that have been loaded.
The number of historic files that are locked in the database (cannot be accessed because they are currently secured for use elsewhere, for example, are being used for a Historic search).
The size of the largest historic file.
The name of the largest historic file.
Indicates the number of historic files that could not be written (‘flushed’) to disk. If this is anything other than 0, there is a problem, and the cause of the problem is indicated in the Error Code column.
Shows the result of writing data to file on disk.
The Error Code is blank if there were no errors writing data to file on disk.
An Error Code is shown if there are errors writing data to file on disk. The error code relates to the first error that occurred and is an operating system error code. It uses the syntax: <error number> - > <error description>.
The name of the first file in which Geo SCADA Expert has detected an error (the error is described in the Error Code column).
Used primarily on a Hot Standby (MAIN), this lists the oldest granule number that you can write to. For Event Journal
Basic Keep online for configured.
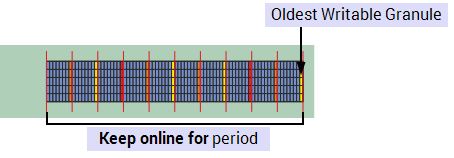
Keep online for extended when Permanent Servers are protected, see Protect Permanent Standby Servers.

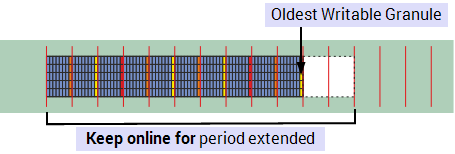
Keep online for extended when Permanent Servers are not protected, see Protect Permanent Standby Servers.

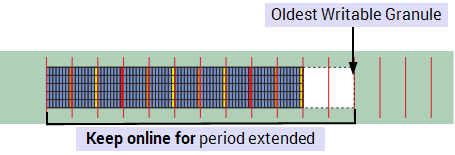
Keep online for with Archive after set, see Define Archive Time for Data.
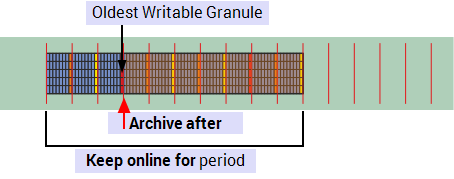
Keep online for with Index after set, see Manage the Size of the Primary Index.
This only applies to Historic data.
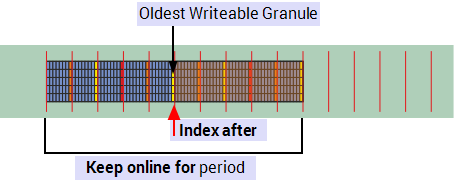
Used primarily on a Hot Standby (MAIN), this lists the oldest writable record time in UTC date and time
Used primarily on a Hot Standby (MAIN), this lists the oldest granule number that you can synchronize when the Keep online for period has been extended and the extended period is protected on the Permanent Standby. When the protected period expires this column does not display any values.
For Event Journal
Keep online for with Archive after set, see Define Archive Time for Data.
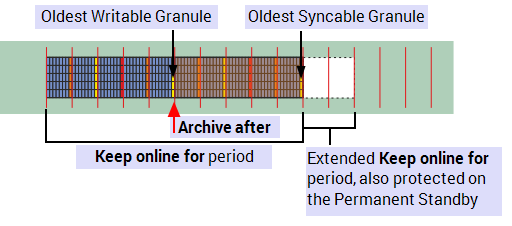
Used primarily on a Hot Standby (MAIN) this lists the oldest syncable record time in UTC date time.
This shows in hours or weeks the remaining amount of protected period remaining when you have extended the Keep online for period. This value should decrease with time until the period expires, see Protect Permanent Standby Servers.
This indicates the date and time in UTC time, when the protected period expires.