If a point has the Historic feature enabled, Geo SCADA Expert keeps a record of the point’s values for a specific time period. You can view this 'historic' data on various displays, including Historic Trends (Graphs). One of the main benefits of viewing historic data on a Historic Trend is that you can see a graphical representation of how the point’s value changed over time and it is also possible to compare the values of different points on a single Trend.
As you have enabled the Historic feature for your internal analog point, and have manually set various values, you can view its data on a Historic Trend:
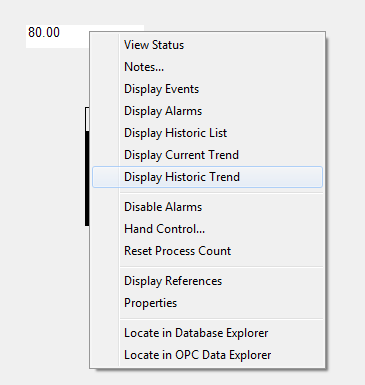
- On the 'MyTestPlant' Mimic (in Run mode), select the animated size bar or text box to access the context sensitive menu.
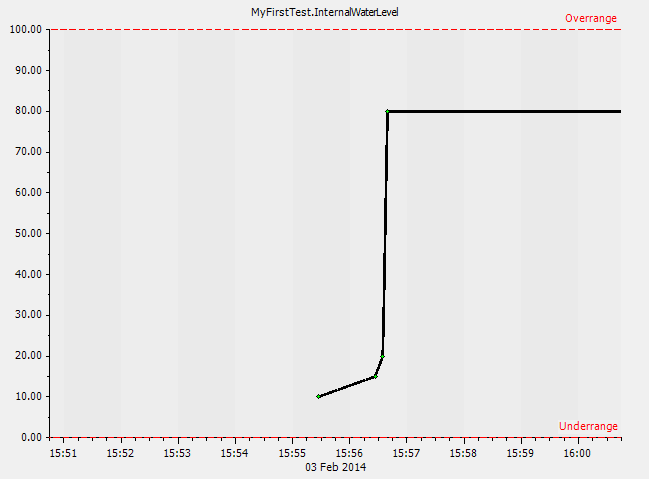
- Select the Display Historic Trend option to display a Historic Trend showing the internal analog point’s historic data (remember that the Display Historic Trend option is for the internal analog point as it is this point that is used to animate the size bar or text box).

You could also access the Display Historic Trend option for the internal analog point by accessing the point’s context sensitive menu in the Database Bar.
Your Historic Trend should show that the internal analog point changed value from 10:00 to 15:00 to 20:00 and then to 80:00.

Before you proceed, close the Historic Trend tab (but leave the Mimic on display). Once you’ve done that, you can move on to the next section which explains how to access another type of historic display—the Historic List (see Display the Historic List for the Internal Analog Point).
Further Information
Trends and Historic Trends: see Configuring Trends.