Welcome to the X-Y Plots Guide
Intended Audience
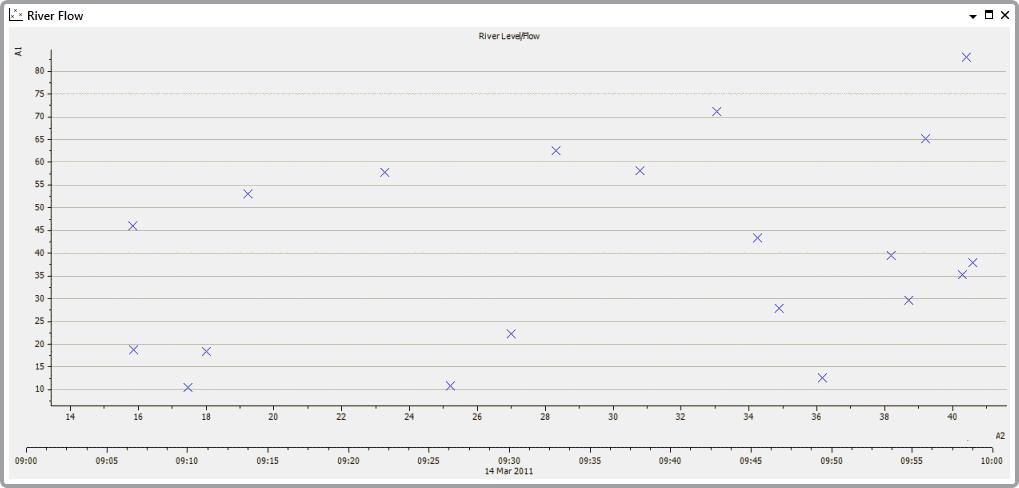
This guide is intended for operator-level users and engineers who need to use or configure X-Y Plots (sometimes referred to as ‘scatter graphs’, ‘scatter trends’ or ‘scatter plots’).
Document Scope
This guide explains how to use Geo SCADA Expert’s X-Y Plots to compare the historic values of related database points in a graphical format.

For more information, see the topics that are listed in the gray footer section at the bottom of this topic. Select the relevant entry to display the topic that you require.