If you want to use an expression that comprises a series of Boolean comparisons, you can use the Flowchart Editor to graphically build that expression:
- Right-click on the required cell in the Data Grid.
A context sensitive menu is displayed. - Select the Flow Chart option.
The Expression Flowchart window is displayed.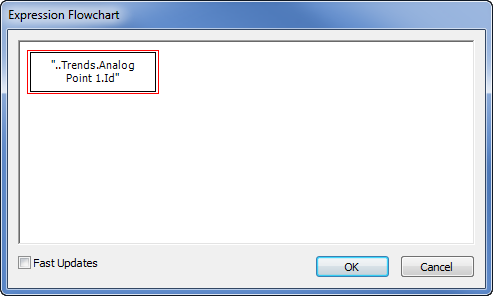
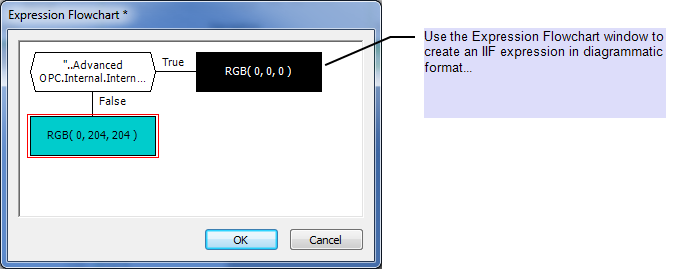
The Expression Flowchart window allows you to create IIF expressions in a diagram format.
- Build the required expression using the Flowchart window. (For more information on using the Expression Flowchart window, see Expression Flowchart in the Geo SCADA Expert Guide to Expressions.)
Example:
- Select the OK button on the Expression Flowchart window.
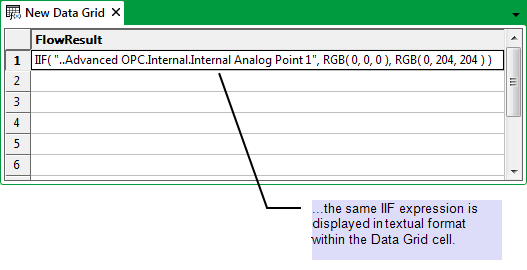
The window is closed and the expression entered in the Data Grid cell.Example: