You need to animate the slices of your pie charts so that they represent values in the database. Each pie chart can contain up to 10 slices.
Each slice has a group of animations:
- Alpha—The Alpha property represents the amount of transparency that is applied to the slice.
The Alpha property works in the same way as the FillAlpha property for lines and shapes except that it animates fill of the slice. For more information, refer to the Fill Animations section (see FillAlpha).
- Colour—The Colour property represents the fill color of the slice. This property works in the same way as the FillColour property for lines and shapes except that it applies to the fill of the slice.
- Label—The Label property represents the label that can be shown on a slice. It is a string value. By animating this property, you can set the slice to display a defined string or you can associate it with a string value of any property in the database, for example, the CurrentStateDesc of a point.
If you enter a text string in the expression for the Label property, the text string has to be enclosed in single quotes. For example, if you enter 'State Display' as the expression, the slice will display:
State Display
If you enter a number, there is no need to enclose it in single quotes ' '.
If you use the Expression window to associate the Label property with a string value for an object in the database, the value that is shown in the slice will not use any formatting settings.
- Value—Use the Value property to associate the slice with the value of an object in the database. Alternatively, you can enter a specific value. The value animation is used to calculate the size of the slice—the value for the Value property is compared to the values for the other slices and the size of the slice is altered accordingly. For example, if there are 2 slices and one has a value of 50 and the other has a value of 150, one slice will take up a quarter of the pie chart (50 out of a total 200 is 25%) and the other slice will take up three quarters of the pie chart (150 out of a total 200 is 75%).
Typically, you will associate the Value property with the CurrentValue property of a database point. You should use the browse button feature of the Expression window to associate the Value property with the required OPC Tag (CurrentValue for example).
Example:
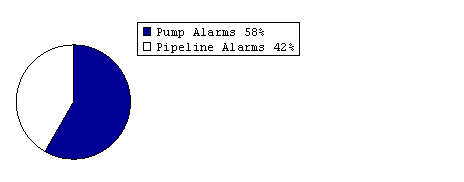
The following pie chart has these animations in place:

- KeyPos—1. The Key is positioned at the right of the pie chart.
- KeyStyle—4. The Key shows the label and percentage for each slice.
- Slice01:
- Alpha—255. (This slice is visible i.e. has 0% transparency).
- Colour—RGB( 0, 0, 150 ). The slice is set to be dark blue.
- Label—'Pipeline Alarms'. The label for the slice shows 'Pipeline Alarms'.
- Value—"Monitor Point 1.CurrentValue". The size of the slice is based on the current value of the Monitor Point 1 database point.
- Slice02:
- Alpha—0. (This slice is invisible, that is, has 100% transparency).
- Colour—RGB( 200, 200, 150 ). The slice is set to a pale shade of yellow/brown but it is not visible as the Alpha setting is 0.
- Label—'Pump Alarms'. The label for the slice shows 'Pump Alarms'.
- Value—"Monitor Point 2.CurrentValue". The size of the slice is based on the current value of the Monitor Point 2 database point.
If you want to remove a slice from a pie chart, you should set the value of the animation for the slice to 0 before you clear it (remove the slice). If the slice animation is not set to 0, the pie chart will continue to show the slice, even after you have cleared the animation for the slice. This is because the pie chart will maintain the previous value of the slice.