You can determine which of the available columns are displayed in the Trend key. The columns categorize the various types of information that can be shown in the key for each trace.For information on the individual columns, see Trend Key.
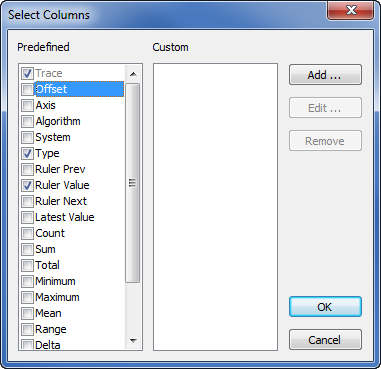
To define which columns are shown on the Key, you need to use the Select Columns window. There are two ways of displaying the Select Columns window:
To set the default columns for all Trends:
- Display the Options window.
- Select the Trends tab and then select the Key Columns button to display the Select Columns window.
When you display the Select Columns window in this way, the choices you make are applied to all Trends by default. You can only choose from the default columns, as custom columns cannot be applied to all Trends (they need to be associated with a specific trace).
To set the columns for a specific Trend:
- Display a Trend that contains a trace, then right-click in the Key and select Columns from the context sensitive menu. The Select Columns window is displayed and contains options that only apply to the current Trend.
When you display the Select Columns window in this way, you can choose from any of the default or custom columns, and can also create, edit or remove custom columns. This is because Geo SCADA Expert can identify the traces that are shown on that Trend (custom columns require a reference to an OPC property in the database, and so have to be associated with a trace).
To configure the key:
- Display the Trend that has the key that you want to configure (see Display a Trend in Design Mode).
- Display the Select Columns window using one of the procedures described at the start of this section. Remember that custom columns are only available for individual Trends.
The Select Columns window contains a Predefined list of columns (see Trend Key) and a Custom section that you can use to add your own columns.

Some columns are only suitable for Historic Trends, for example, the Algorithm column can only show data when used on a Historic Trend. This is because algorithms are not applied to current data.
- Select the columns that you want to be shown in the Trend Key:
- Select the check boxes for those predefined columns that you want to be displayed in the Trend key.
- Clear the check boxes for those predefined columns that you want to exclude from the Trend key.
If you have displayed the Select Columns window via the Columns option on the Key’s context sensitive menu, you can use custom columns. If you want to use custom columns, proceed to step 5. If you have no requirement for custom columns on the Trend, proceed to step 12.
If you have displayed the Select Columns window via the Options window, you can only use the default (predefined) columns. Proceed to step 12.
-
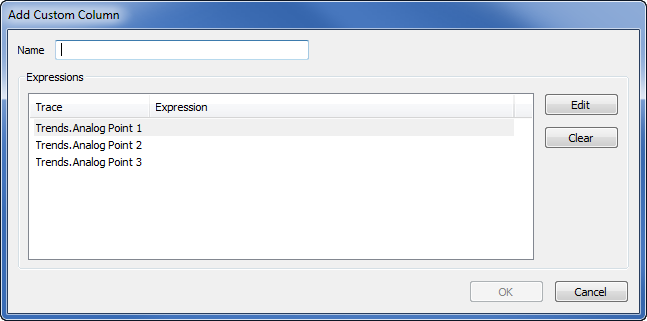
Select the Add button to display the Add Custom Column window.

You can use the Add Custom Column window to create new columns that can be shown on the Trend’s key. The columns use expressions to define the value that they display, similar to animations on Mimics. As with animations, the expressions can refer to OPC tags and can use functions and so on, in the expressions syntax. For more information on expressions, see Welcome to the Guide to Expressions.
- Enter the column Name (it should describe what the column will contain).
- In the Expressions list, select the trace for which you want to enter the expression.
-
Select the Edit button.
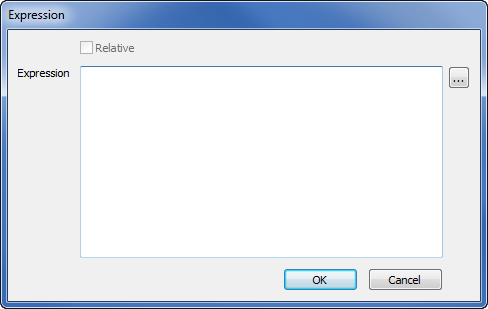
The Expression window is displayed.
- Define an Expression for the trace. The expression defines the source of the data that is shown in the custom column for the selected trace. Typically, the source is a property of a specific point. For example, if you created a custom column to show whether the source of the trace is under exclusive control, you could create the following expression:
"System:AI1.ExclusiveCtrlActive"
Where System is the name of your system, AI1 is the name of the database point that provides the data for the trace (the trace’s source) and ExclusiveCtrlActive is the property of the point. The value of the ExclusiveCtrlActive property indicates whether the point is under exclusive control and will be shown in the custom column for the trace. (The custom column will show 0 if the point is not under exclusive control or 1 if the point is under exclusive control).
For more information on using the Expression window and creating an expression, see Using the Expression Editors.
- Select the OK button.
The Expression window is closed and the expression is displayed in the Add Custom Columns window. - Select the OK button to confirm the settings for the new column.
The Add Custom Column window is closed and the new column is added to the Custom list on the Select Columns window.If you need to change the configuration of a custom column, select the custom column from the list and then select the Edit button to display the Edit Custom Column window. This window works in the same way as the Add Custom Column window (see step 5).
If you need to remove a custom column, select the custom column from the list and then select the Delete button.
When you are satisfied with your selection of predefined columns and custom columns, proceed to step 12.
- Select the OK button to confirm your choices and close the Select Columns window.
The Select Columns window is closed and the Trend key displays the columns you selected. - Save the configuration.