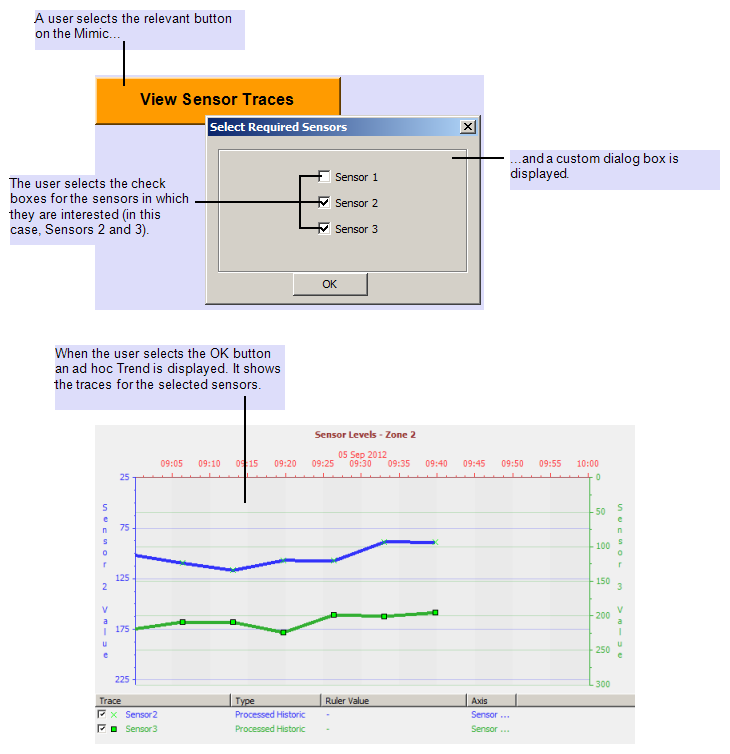
This example demonstrates how a dialog box might be used to enable users to specify which traces they want to view on an ad hoc Trend.
The example uses Geo SCADA Expert scripting to display the dialog box from a Mimic. Users can select any combination of three check boxes to indicate which trace(s) they want to include on the Trend.
Example:
Users are able to view any combination of up to three traces on an ad hoc Trend. The Trend is displayed via a button on a Mimic. When the button is selected, a custom dialog box is displayed. The dialog box contains three check boxes—one for each trace—and an OK button. Users select the check boxes for the trace(s) that they want to view, then select the OK button to confirm their choice and display the ad hoc Trend, showing the selected trace(s).

To enable this functionality, scripting is enabled on the Mimic (see Enable the Scripting Feature on a Mimic).
VBScript™ is used to write the required script subroutines. The main subroutine (called ‘mainProg’) includes:
- The TrendSpec definition for the ad hoc Trend (including a separate TRACE and corresponding YAXIS section for each of the three possible traces)
- A routine to check which combination of the three check boxes is selected on the dialog box when the OK button is activated
- The Geo SCADA Expert script hyperlink function Mimic.OpenInset, to display the ad hoc Trend in a separate window that is inset into the Mimic window.
A separate subroutine (called ‘ TraceCheckBoxDlg’) is used to define the custom dialog box, its content and functionality.
sub MainProg
Dim showTrend
Dim traceChecks(3)
Dim sTrendProps
Dim sTraces(3)
Dim sYAxis(3)
Dim sXAxis
Dim sTrend
showTrend = False
sTrend = "SCX:////Trend/TREND("
sTrendProps = "Title = 'Sensor Levels - Zone 2',"
sTrendProps = sTrendProps & "TitleColour = RGB(150,50,50),"
sTrendProps = sTrendProps & "TitleFontStyle = FontStyleBold),"
sXAxis = "XAXIS(RelativeNow, Position=Top,"
sXAxis = sXAxis & "Colour = RGB(255,50,50)),"
sTraces(0) = "TRACE(ProcessedHistoric,'Y Axis 1',"
sTraces(0) = sTraces(0) & "SOURCE('AdHocTrends.Sensor1',XOffset = 15,"
sTraces(0) = sTraces(0) & "YOffset = 12, Multiplier = 3),"
sTraces(0) = sTraces(0) & "Label = 'Sensor1',TraceStyle = TraceLine,"
sTraces(0) = sTraces(0) & "Interval = 400, PointLimit = 20,"
sTraces(0) = sTraces(0) & "ExtendToNow = False,"
sTraces(0) = sTraces(0) & "LineColour = RGB(250,50,50),"
sTraces(0) = sTraces(0) & "LineStyle = DashSolid,"
sTraces(0) = sTraces(0) & "LineWidth = 3, MarkerStyle = Diamond,"
sTraces(0) = sTraces(0) & "MarkerLimit = 250, MarkerSize = 3),"
sYAxis(0) = "YAXIS('Y Axis 1',Label = 'Sensor 1 Value',"
sYAxis(0) = sYAxis(0) & "LabelPos = Centre,LabelStyle = Normal,"
sYAxis(0) = sYAxis(0) & "Position = Left,ScaleType = Range,"
sYAxis(0) = sYAxis(0) & "Invert = true,ShowGrid = True,"
sYAxis(0) = sYAxis(0) & "Format = '%23%23.%23%23%23',"
sYAxis(0) = sYAxis(0) & "Colour = RGB(250,50,50)),"
sTraces(1) = "TRACE(ProcessedHistoric,'Y Axis 2',"
sTraces(1) = sTraces(1) & "SOURCE('AdHocTrends.Sensor2',"
sTraces(1) = sTraces(1) & "XOffset = 15, YOffset = 12, Multiplier = 3),"
sTraces(1) = sTraces(1) & "Label = 'Sensor2',TraceStyle = TraceLine,"
sTraces(1) = sTraces(1) & "Interval = 400, PointLimit = 20,"
sTraces(1) = sTraces(1) & "ExtendToNow = False,"
sTraces(1) = sTraces(1) & "LineColour = RGB(50,50,250),"
sTraces(1) = sTraces(1) & "LineStyle = DashSolid,"
sTraces(1) = sTraces(1) & "LineWidth = 3, MarkerStyle = Cross,"
sTraces(1) = sTraces(1) & "MarkerLimit = 250, MarkerSize = 3),"
sYAxis(1) = "YAXIS('Y Axis 2',Label = 'Sensor 2 Value', LabelPos = Centre,"
sYAxis(1) = sYAxis(1) & "LabelStyle = Normal,Position = Left,"
sYAxis(1) = sYAxis(1) & "ScaleType = Manual,Invert = True,"
sYAxis(1) = sYAxis(1) & "ShowGrid = True,Format = '%23%23.%23%23%23',"
sYAxis(1) = sYAxis(1) & "Colour = RGB(50,50,250),"
sYAxis(1) = sYAxis(1) & "Maximum = 230, Minimum = 25),"
sTraces(2) = "TRACE(ProcessedHistoric,'Y Axis 3',"
sTraces(2) = sTraces(2) & "SOURCE('AdHocTrends.Sensor3',"
sTraces(2) = sTraces(2) & "XOffset = 15, Multiplier = 3),"
sTraces(2) = sTraces(2) & "Label = 'Sensor3',TraceStyle = TraceLine,"
sTraces(2) = sTraces(2) & "Interval = 400, PointLimit = 20,"
sTraces(2) = sTraces(2) & "ExtendToNow = False,"
sTraces(2) = sTraces(2) & "LineColour = RGB(50,175,50),"
sTraces(2) = sTraces(2) & "LineStyle = DashSolid,"
sTraces(2) = sTraces(2) & "LineWidth = 3, MarkerStyle = Square,"
sTraces(2) = sTraces(2) & "MarkerLimit = 250, MarkerSize = 3),"
sYAxis(2) = "YAXIS('Y Axis 3',Label = 'Sensor 3 Value',"
sYAxis(2) = sYAxis(2) & "LabelPos = Centre,LabelStyle = Normal,"
sYAxis(2) = sYAxis(2) & "Position = Right,ScaleType = Range,"
sYAxis(2) = sYAxis(2) & "Invert = True,ShowGrid = True,"
sYAxis(2) = sYAxis(2) & "Format = '%23%23.%23%23%23',"
sYAxis(2) = sYAxis(2) & "Colour = RGB(50,175,50)),"
TraceCheckBoxDlg traceChecks
dim idx
For idx = 0 To 2
If traceChecks(idx) = True Then
sTrend = sTrend & sTraces(idx)
sTrend = sTrend & sYAxis(idx)
showTrend = True
End If
Next
if showTrend = True Then
sTrend = sTrend & sXAxis
sTrend = sTrend & sTrendProps
Mimic.OpenInset( sTrend ),20,20,70,70
End If
End Sub
sub TraceCheckBoxDlg( traceChecks )
Dim OKButton
Form.Init "Select Required Sensors"
Form.AddGroupBox 0,0,50,10,""
Set traceChecks(0) = Form.AddCheckBox(20,2, "Sensor 1")
Set traceChecks(1) = Form.AddCheckBox(20,4, "Sensor 2")
Set traceChecks(2) = Form.AddCheckBox(20,6, "Sensor 3")
Set OKButton = Form.AddPushButton(15,10,"OK")
Form.Show()
If Form.Selection = "OK" Then
End If
End sub
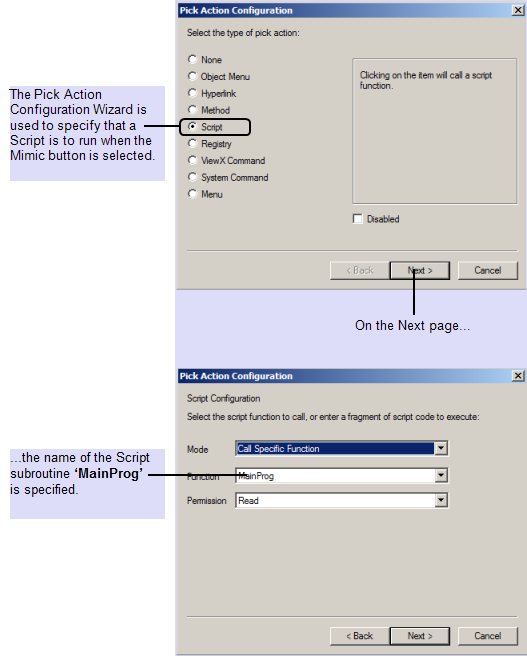
A button configured on the Mimic is used to call the ‘MainProg’ script subroutine. This functionality is enabled using the Pick Action Configuration Wizard (accessed via the Button Properties window):

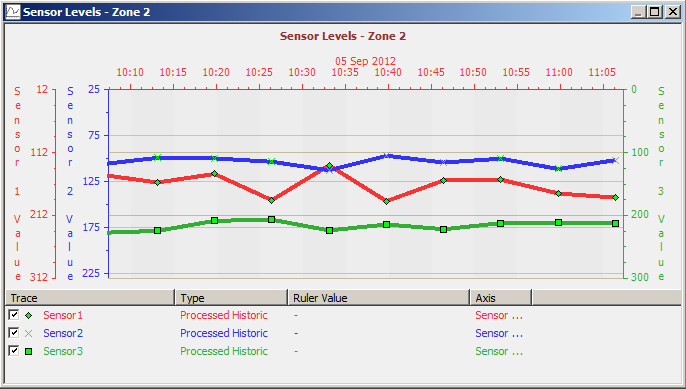
The Mimic script enables any combination of three traces to be displayed on the ad hoc Trend. The check boxes that are selected on the custom dialog box determine which traces and associated Y-Axes are shown on the Trend. The TrendSpec definition used in the script determines the Trend’s properties.
So, if the three check boxes are selected on the dialog box, each of the three traces and Y-Axes are displayed. The TrendSpec definition sets the Trend’s properties (such as the color and location of the axes):

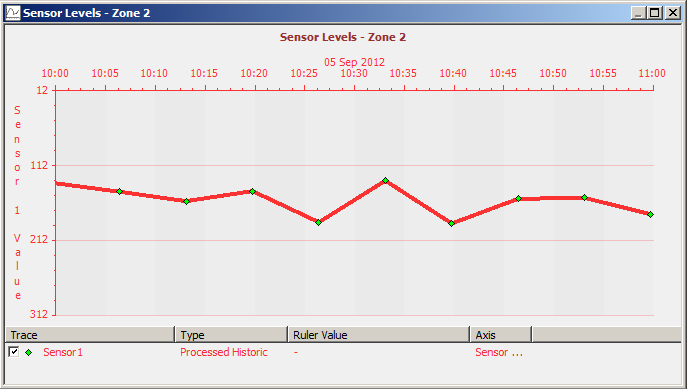
Whereas if only the Sensor 1 check box is selected, only Sensor1’s trace and y-axis are shown:

With this particular TrendSpec definition, the Multiplier optional value is used to multiply each sensor’s value by 3 before displaying the resultant value on the Trend (each sensor’s original range being 0 to 100). Additionally, with two of the sensors, the YOffset optional value is used to offset the sensor value by 12 when plotted against the corresponding y-axes. Geo SCADA Expert uses these values in conjunction with each y-axis’s ScaleType (and, if applicable, any Maximum and Minimum values) to discover what range it needs to display for each y-axis.
In a TrendSpec definition, ensure that you specify the Maximum value before the Minimum value when including such optional values for the y-axis.
Hence, the y-axis for Sensor3 runs from 0 to 300 (as ScaleType = Range and Multiplier = 3 expands the original 0 to 100 sensor range to three times its original value).
With Sensor2, the y-axis range of 25 to 230 is determined by the YAXIS Optional Values ScaleType = Manual, Maximum = 230 and Minimum = 25.
With Sensor1, the y-axis runs from 12 to 312 (as ScaleType = Range, Multiplier = 3, and YOffset = 12). With this sensor and Sensor2, Geo SCADA Expert multiplies the original sensor values by 3, then increments the results by 12 before plotting the resulting values on the Trend. Hence with Sensor1, the y-axis range is also offset by 12.
As with any TrendSpec definition, Geo SCADA Expert uses the current ViewX defaults for any Optional Values that are not explicitly defined.
Further Information
Add and Configure a Button on a Mimic: see Add a Button to a Mimic, and see Editing a Button.
Using the Script Configuration page of the Pick Action Configuration Wizard: see Associate a Mimic Script with a Script Pick Action.
Geo SCADA Expert-Specific Script Functions: see the Geo SCADA Expert Guide to Scripting.