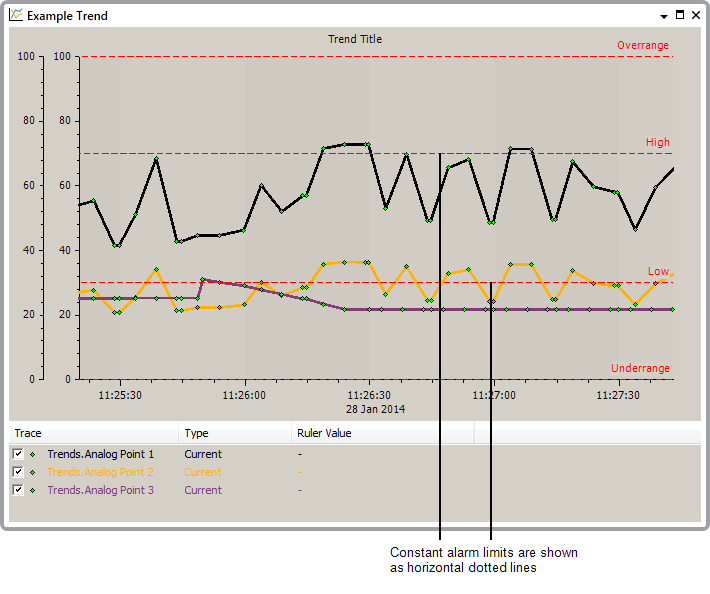
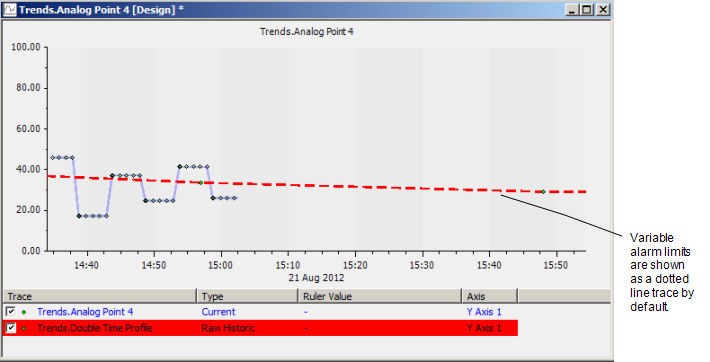
When a point is used as the source of a Trace, it is possible to display the point’s alarm limits on the Trend. The alarm limits are useful when you want to compare the values plotted on the trace to the point’s High High, High, Low, and Low Low thresholds.
There are two types of alarm limits:
- Constant Alarm Limits—Alarm limits that are fixed at a specific amount and are defined in the configuration of a point. Many point types have constant alarm limits.
For example, the constant alarm limits for an analog point are defined in the point’s configuration, and match the value settings for the various thresholds (High High, High, Low, Low Low). So if the High limit is defined as 70, the High threshold for the point is fixed at 70 (unless the configuration is altered).

Constant alarm limits are shown as horizontal, dotted lines and can be displayed and hidden by using the Show and Hide options (see Hide and Show the Alarm Limits). The lines are red by default, but you can change the color on a system-wide basis, if required (see Define the Colors for Point Trends)).
You can also use the Geo SCADA Expert Server Configuration Tool to change the default color from red to a color of your choice (see Define the Colors for Point Trends)).
- Variable Alarm Limits—Alarm limits that vary according to the time of day. Variable alarm limits require the point to be associated with a Time Profile and are only available for analog points on certain drivers.
A point can have one or more of its alarm limit thresholds associated with a Time Profile. The configuration of the Time Profile defines different values for different times of the day, for example, a Time Profile could be configured to have a value of 80 during daytime and 50 at night. If the Time Profile is then associated with the High limit of an analog point, it would mean that the point's High alarm limit would change from 50 to 80 and back to 50 depending on the time of day.
Variable alarm limits are shown on Trends as a trace rather than a line (as the alarm limit varies and so has to be plotted). By default, the variable alarm limits are similar in appearance to constant alarm limits, with the trace shown as a red dotted line (on ad hoc Trends - they use the same default settings as traces on a configured Trend). You can alter the appearance of the variable alarm limits by editing the trace (see Configure the Display Settings for a Trend). >

As variable alarm limits are treated as traces, they are unaffected by the Show and Hide Alarm Limits options. To display or hide a variable alarm limit, you need to use the Show and Hide Trace options for the variable alarm limit trace.
If an analog point has constant values for some of its alarm limits and uses a Time Profile for others, both types of alarm limit will be shown on Trends for the analog point.
Further Information
Hide and Show the Alarm Limits.
Time Profiles: see Configuring Time Profiles.