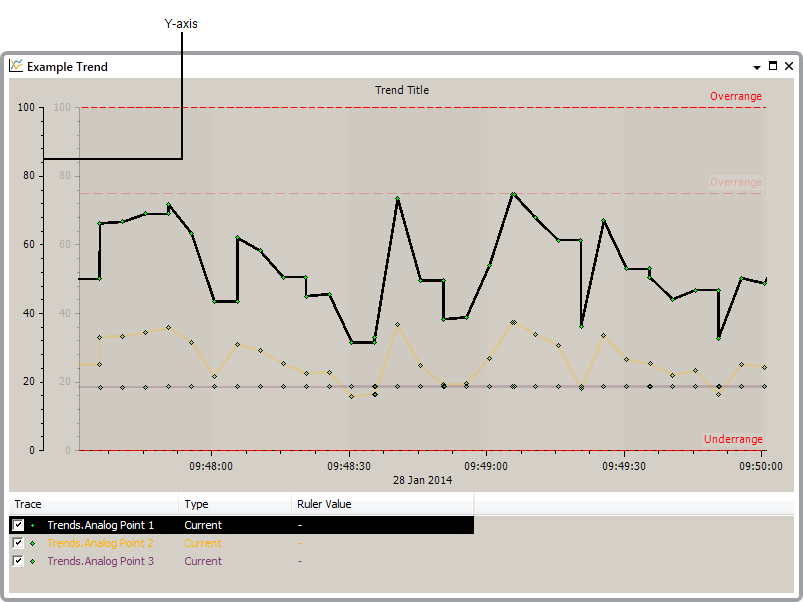
By default, each Trend has a Y-Axis that is displayed on the left-hand side. It provides a scale that allows you to determine how the point values (shown on the trace) compare to the entire range of possible values. A Trend has tohave at least one Y-Axis and can have multiple Y-Axes if required.

The Y-Axis uses numerical values as a scale for the range of possible values. It also has a title which you can configure so that other users can see what the values on the Y-Axis represent (see Configure a Y-Axis).
Each Trend can display one or more Y-Axes (see Add a Y-Axis). The Y-Axes are added during configuration of the Trend and are used to show different scales. For example, a Trend could have two Y-Axes and two traces (each Y-Axis represents the scale for one of the traces). When multiple Y-Axes are shown, the Y-Axes that do not apply to the currently selected trace are faded out. This helps you to identify which range of values apply to the selected trace.
To configure a Y-Axis, you will need to log on via a User Account that has the Configure permission for the Trend.