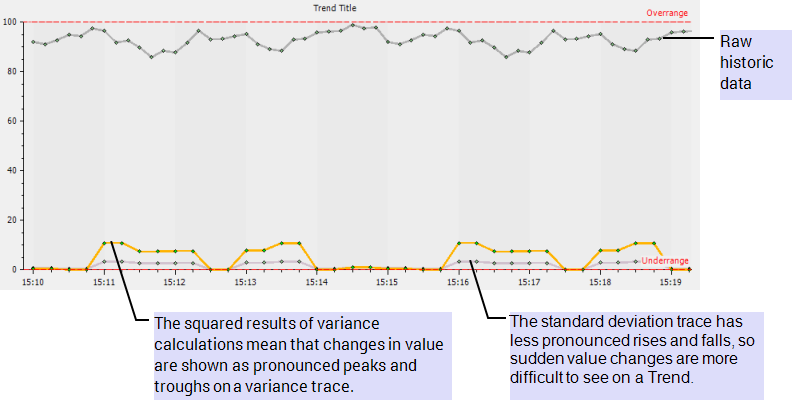
Like standard deviation StdDev), the variance algorithm is a statistical calculation that is used to measure the spread of values over a time period. It is useful when investigating patterns in data, especially on Trends as the squared results mean that peaks and troughs in the data are more noticeable than the standard deviation version of the same data. However, the results of variance calculations are squared, so they use different base units to the data source. For this reason, many statisticians prefer to use standard deviation when assessing the spread of values (standard deviation uses the same base units as the data source; the square root of the variance is the standard deviation).
To calculate the variance value for a sample, Geo SCADA Expert:
- Calculates the mean average of the values in the sample
- For each raw historic value in the sample, Geo SCADA Expert subtracts the mean average and then squares the result
- Finally, Geo SCADA Expert calculates the mean average of the results of Step 2. The result is the variance value.
Example:
A processed historic trace is added to a Trend to represent a point’s historic data. The point is updated every 10 seconds, and has point limits from 0 to 100.
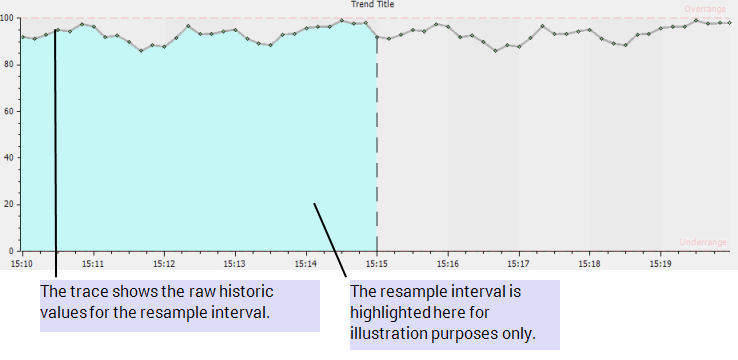
The trace uses the Variance algorithm and has an Interval of 5M. So Geo SCADA Expert calculates the variance value for every five minutes (each sample contains 5 minute’s worth of raw historic data - 30 raw historic values).
At 15:10, Geo SCADA Expert has to plot a variance value. To do this, it takes the raw historic values for the period 15:10 to 15:15, which are: 92.02, 91.14, 92.83, 94.93, 94.42, 97.53, 96.48, 91.82, 92.62, 89.75, 85.91, 88.43, 87.75, 91.65, 96.59, 93.13, 93.19, 94.40, 95.14, 91.17, 89.16, 88.36, 93.01, 93.32, 95.80, 96.29, 96.43, 98.96, 97.57, 97.91. Geo SCADA Expert then calculates the mean average of these values, which is 93.65.

For each value in the sample, Geo SCADA Expert subtracts the average value of 93.65 and then squares the result (so there are 30 results). Geo SCADA Expert then calculates the mean average of the 30 results, which produces a single value - the variance for the period 15:10 to 15:15. In this case, the variance is 11.16.
As the variance value does not use the same base units as the raw historic data, the value of 11.16 has little meaning. For this reason, many statisticians prefer to use standard deviation rather than variance, as standard deviation does use the same base units as the raw historic values (it is the square root of the variance). So for the same sample of raw historic data, the standard deviation algorithm would produce the value 3.4, which means that the majority of raw historic values in the sample are between 3.4 under or over the average value for the sample. So if the point was used to measure water level in liters, the majority of the point’s values for the sample would be within 3.4 liters of the average water level for that period.
While many statisticians prefer to use standard deviation, the variance algorithm can be useful, especially when viewing data on Trends. This is because the squared values of variance results make the rises and falls in values easier to view on a Trend (standard deviation values tend to be lower and so show less pronounced rises and falls).
