You can choose to hide the Title, Time Line, or axes so that the remaining features of the X-Y Plot make maximum use of the display area. This is useful when you only require some of the X-Y Plot features.
When you have hidden a Title, axis, or Time Line, you can use the Show options to redisplay the features as required.
To show and hide the Title, X-Axis, Y-Axis, or Time Line:
- Display an X-Y Plot in Run Mode.
The Hide and Show options are also available when you are configuring the X-Y Plot in Design mode.
- Right-click on the X-Y Plot display (anywhere above the X-Axis and to the right of the Y-Axis, that is the area in which the values are shown).
A context sensitive menu is displayed. - Select or clear the relevant option (when selected the option is prefixed with a check mark):
- Show Title—To show/hide the Title. Select the Show Title option to display the Title. Clear the option to hide the Title.
- Show X Axis—To show/hide the X-Axis. Select the Show X Axis option to display the X-Axis. Clear the option to hide the X-Axis.
- Show Y Axis—To show/hide the Y-Axis. Select the Show Y Axis option to display the Y-Axis. Clear the option to hide the Y-Axis.
- Show Time Axis—To show/hide the Time Line. Select the Show Time Axis option to display the Time Line. Clear the option to hide the Time Line.
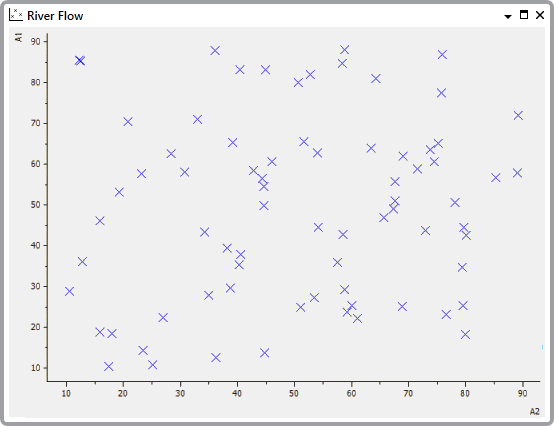
Example:
An X-Y Plot showing the X-Axis and Y-Axis, but hiding the Title and Time Line.