Intended Audience
This guide is intended for use by Operators and administrators that use X-Y-Z Plots to compare sets of historic data values and Engineers who are responsible for creating and configuring X-Y-Z Plots in the database.
Document Scope
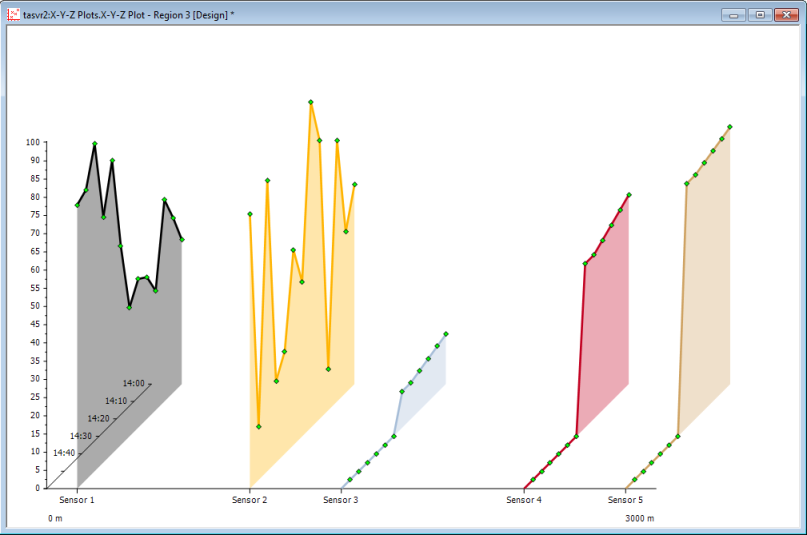
In this guide, we explain how to configure and use X-Y-Z Plots. X-Y-Z Plots are special types of Trends that you can use to compare the relationship between multiple sets of historic values.

This guide provides an introduction to X-Y-Z Plots. For more information, see the topics that are listed in the gray footer section at the bottom of this topic. Select the relevant entry to display the topic that you require.
You can display X-Y-Z Plots on ViewX or WebX clients. However, as with other database items, you can only configure X-Y-Z Plots on a ViewX client.