NOTICE
UNEXPECTED BEHAVIOR OF APPLICATION
You can hide a trace's content in Run or Design mode. If you are working in Design mode, ensure that the required trace content remains on show when saving the plot's configuration. Content that is hidden when the configuration is saved will continue to remain hidden from view by default.
Failure to follow these instructions can result in data being omitted from display unintentionally
You can show or hide or a subset of the content, that is associated with an individual data source. To do this:
- Right-click on the tick (short line) that indicates the trace's position on the x-axis.
A context-sensitive menu is displayed - Select the Show option.
A further context-sensitive menu is displayed.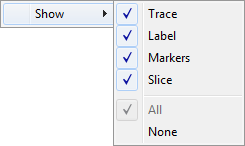
The 'Trace' option is only available if the X-Y-Z Plot's Drawing Mode is set to 'Connect by Point' or 'Connect by Point and Timestamp' (see Configure the Background Color and Drawing Mode).
- Perform one of the following:
- To hide a subset of the content, deselect the relevant menu option (so that the menu option no longer displays a check mark).
- To hide the whole trace entry, select the 'None' option.
- To display content that is currently hidden, select the relevant menu option (so that the menu option displays a check mark).
- If a subset of the content is currently hidden, to display the whole set of information that is associated with the trace, select the 'All' option.
For more information about displaying or hiding the content that is associated with an individual trace, including worked examples where applicable, see the topics that are listed in the gray footer section at the bottom of this topic. Select the relevant entry to display the topic that you require.