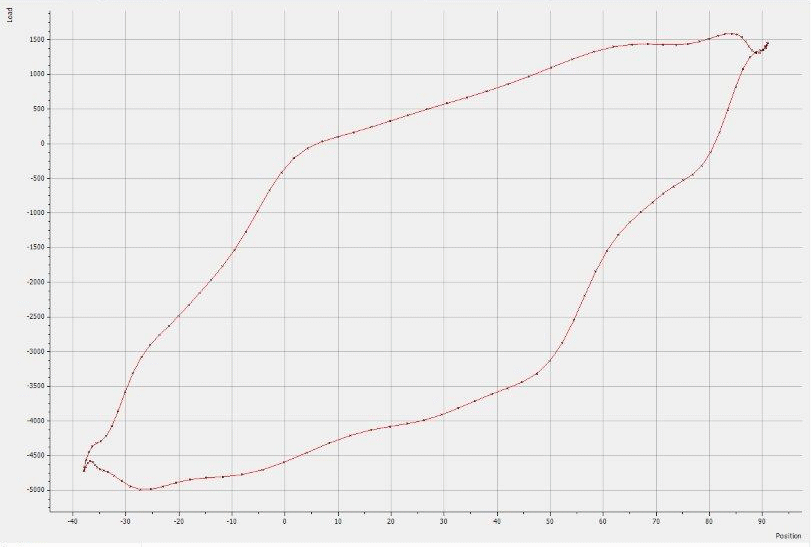
Dynagraphs are used with drivers that provide data about oil field pumping conditions.
The oil industry uses Dynamometers to monitor the operation of the pumpjacks that pump fluid to the surface of the wells. The data obtained is stored in dynamometer ‘cards’ (also known as ‘Dynacards’).
You can upload the dynacard data into Geo SCADA Expert and then use Dynagraph database items to view the data from a particular type of dynacard.

The Dynagraph shows the data as a plot, providing a comparison between the loading on the pump rod and the position of the pump in the well. From the shape of the trace that is displayed, a trained eye can detect whether the pump is operating efficiently and the well refilling as expected. You can optionally also include the trace from a ‘Reference Card’. The ‘Reference Card’ contains data against which the other dynacard data can be compared.
Depending on the type of dynacard data that a Dynagraph displays, you can optionally view data from multiple dynacards on the same Dynagraph. Each set of data is displayed as a separate trace.
You can use the Dynagraph’s key to obtain further information about each trace, such as the date and time at which Geo SCADA Expert uploaded the data.
For more information, see the topics that are listed in the gray footer section at the bottom of this topic. Select the relevant entry to display the topic that you require.
Further Information
A Dynagraph displays dynacard data that is stored in a Dynacard Store (see Dynacard Stores).