You can create single-layer maps or multi-layer composite maps in Geo SCADA Expert, from online or offline mapping sources, which you can then use for a variety of purposes. For example, you can display:
- The geographic location of items in the Geo SCADA Expert database
- Geographic information, such as weather data.
Once you have created a map, you can then display it in Geo SCADA Expert (see Displaying a Geo SCADA Expert Map).
An example of a typical Geo SCADA Expert map is shown below:
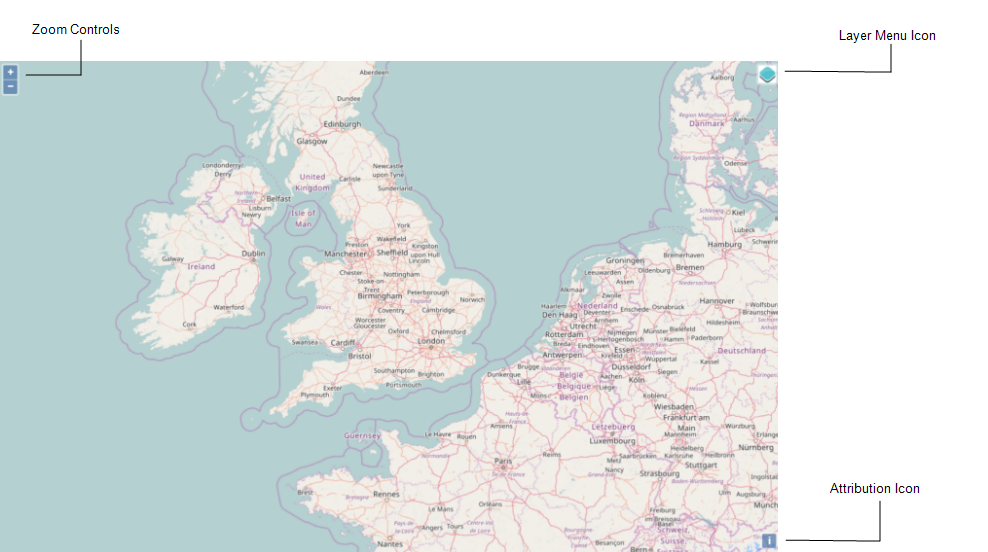
A Geo SCADA Expert map has zoom controls and may have an Attribution Icon (if there is attribution information for the map's base layer). Multi-layer maps will also have a Layer menu. These items are described in detail below.
NOTE: If necessary, you can re-position the map by dragging it.
Zoom Controls
You can use the zoom controls to show more map detail or less detail. The zoom controls look like this:

- Use the
 button to zoom in on a particular location to show more detail.
 - Use the
 button to zoom out to show less detail.
Alternatively, if you have a mouse-wheel, you can use it to zoom in and out from the current cursor position.
To zoom in and out on a specific location on the map, right-click on the location and Geo SCADA Expert will display the Zoom menu:
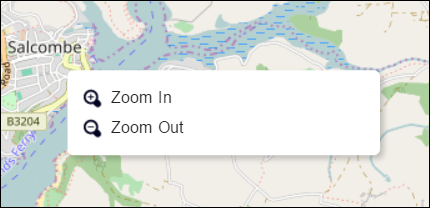
Select the appropriate option.
Layer Menu
The Layer menu contains a list of the user query, base layer and overlay options that you can display on the map (for more about layers, see About Geo SCADA Expert MapsFor more about user queries, see Configuring a User Query in the Geo SCADA Expert Guide to Core Configuration).
To display the Layer menu, select the ![]() icon in the top right-hand corner of the map. A typical Layer menu is shown below:
icon in the top right-hand corner of the map. A typical Layer menu is shown below:
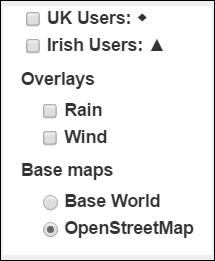
NOTE: The symbol to the right of a user query option at the top of the menu indicates the shape of the map marker that represents the query on a Geo SCADA Expert map (see About Map Markers). The same symbol may be associated with more than one user query if there are more than three user queries on the menu.
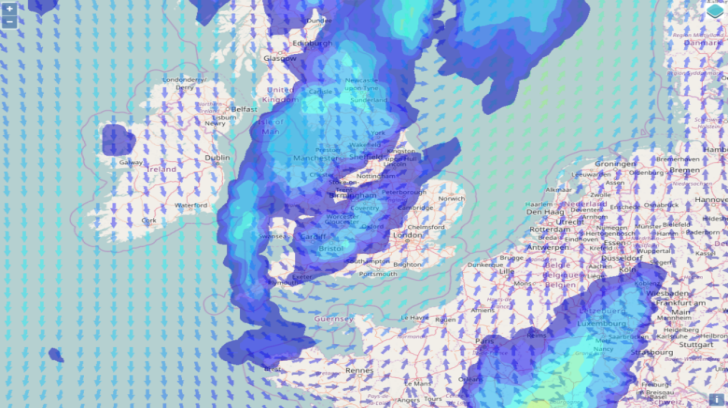
For example, if you select the OpenStreetMap base layer and the overlay options, Wind and Rain:
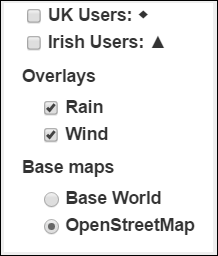
The map display might look like this:
Attribution Icon
Click on the Attribution Icon ![]() to view attribution details for the map's base layer (if these details are available).
to view attribution details for the map's base layer (if these details are available).