Accumulative algorithms are calculations that are performed on a set of values in the current sample. They are useful for calculating historic values at set times for a defined time period. For example, calculating the minimum value every hour for a day. The type of calculation that the algorithm represents is defined in the algorithm's configuration and can be:
- Min—Calculates the minimum value during the sample.
- Max—Calculates the maximum value during the sample.
- Mean—Calculates the mean average value during the sample.
- Integrator—Calculates the total value during the sample.
- Rate of Change—Calculates the rate at which values are changing during the sample.
- Runtime—Calculates the amount of time that an item, such as a point, remains in the same state.
- Counter—Calculates accumulative values during the sample.
To calculate the historic value, Geo SCADA Expert uses a sample. The sample is a set of values that are reported during a defined time. For example, to calculate the hourly average, Geo SCADA Expert uses a sample of values that were reported during an hour period.
The start time of the sample is the first time on the X-Axis of a Trend, or is defined in a Historic View which can be accessed by an SQL Query (see Historic Views). The start time is rounded down to the start of the resample time unit, for example, rounded down the start of the hour.
The end time of the sample is defined by the Reset Multiplier setting of the accumulative algorithm.
ST programs can access the historic algorithms directly via the %H tag.
The rate at which the historic values are calculated is defined by the interval (the amount of time that elapses between each calculation).
The Reset Multiplier setting defines the end time of a sample and is similar to a point's End of Period Reset setting
Example:
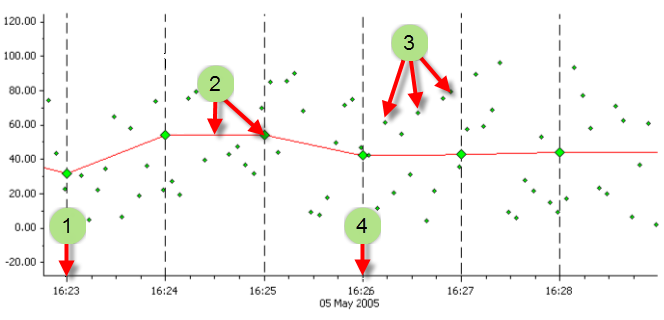
For example, if a historic Trend has a trace interval of 1M (1 minute) and the Reset Multiplier setting is 4, there are four 1 minute samples that form a 4 minute sample period.
A historic value is calculated after 1 minute based on the values reported during that minute.
A second historic value is reported after 2 minutes, based on the values reported in the first 2 minutes (both the first minute sample and the second minute sample). Similarly, the third value is based on the values in the first 3 minutes, and the fourth value is based on the values in minutes 1, 2, 3, and 4.
When the fourth value has been calculated, the sample is reset and the second sample period begins. The next historic value that is reported will only use the values in the second sample period—the values from the first sample are ignored.

- The algorithm is used to calculate the historic value every minute.
- Large green markers and a red trace show average values calculated by the algorithm
- Small green markers show actual historic values reported during the minute intervals.
- With the algorithm's Reset Multiplier set to 4 (4 x the interval of 1 minute), the sample period is reset after 4 minutes. The calculated values in the next 4 minutes do not use the values from the previous samples.