Raw historic data is data that has been stored historically in the Geo SCADA Expert database with exactly the same values that were originally reported. For example, if a point is configured to have its data stored historically, and its current value is 6.0, then 6.5, then 6.4, then 6.2, the values will be stored as 6.0, 6.5 and 6.4 historically.
With Trends, you can configure a trace to represent raw historic data for any point or forecast that has the Historic feature enabled.
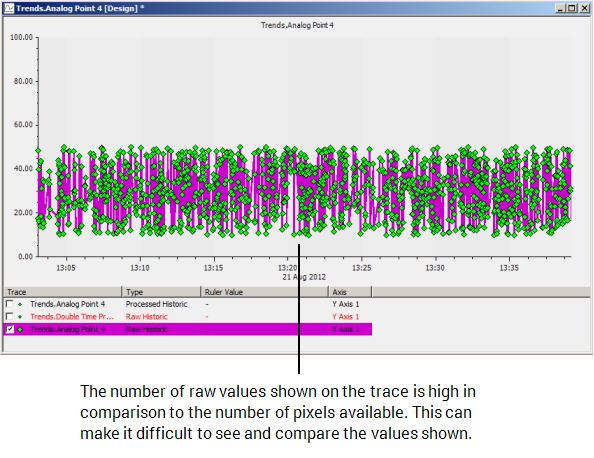
Raw historic data traces are often used in favor of processed historic traces as they are more accurate - they represent the actual values that were reported. However, in some circumstances, using a raw historic data trace can result in an impractical Trend. This is because if a trace has a high density of values for the time range of the Trend, the trace can become difficult to read.

If you want to view the actual historic values of a point or forecast on a trace, you need to choose the Raw Historic Trace option when you add the trace to a Trend.
When choosing to display raw historic values, you need to be aware that if the trace has to show an excessive amount of values, the trend may become difficult to use. If you have a cluttered trace, you can reduce the amount of values shown by adjusting the time range on the X-Axis. However, this also means that you have to compromise with the time range that is shown on the Trend.
You also need to consider the Point Limit setting of the trace. Each raw historic trace has a Point Limit setting that defines the maximum number of values that can be shown on the trace. If this number is exceeded, Geo SCADA Expert switches the trace to Summary Mode for Raw Historic Traces. In Summary Mode, the trace is set to use processed historic data temporarily.