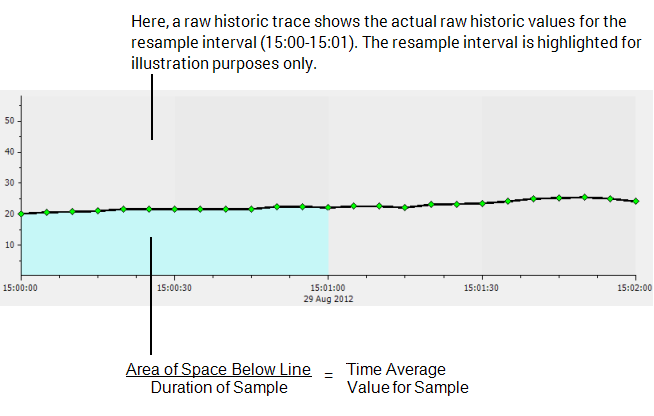
The Time Average algorithm calculates a time-weighted average of the values in a sample. Unlike the Average algorithm which simply divides the sum of the values in the sample by the number of values, the Time Average algorithm takes into account the amount of time between value changes. This means that the average value is more indicative of the actual values in the sample and is less influenced by a small number of unusual, fleeting values.
For example, let's say a point has historic enabled and updates every 5 seconds. This means it has 12 raw historic values per minute. For the minute period 15:00 to 15:01, the point has the following values:
|
Timestamp |
Raw Historic Value |
|---|---|
|
15:00.00 |
20.11 |
|
15:00.05 |
20.62 |
|
15:00.10 |
20.78 |
|
15:00.15 |
21.02 |
|
15:00.20 |
21.65 |
|
15:00.25 |
21.65 |
|
15:00.30 |
21.65 |
|
15:00.35 |
21.65 |
|
15:00.40 |
21.65 |
|
15:00.45 |
21.65 |
|
15:00.50 |
22.45 |
|
15:00.55 |
22.45 |
With these values, an average algorithm would simply add up the raw historic values and then divide the total by 12. The result would be 21.44, which provides little indication that for over half of the sample, the point value was over 21.65.
The time average works differently - it performs a calculation that takes into account the amount of time that a value remains unchanged. This calculation is the equivalent of plotting the values in the sample on a Trend and then:
- Calculating an interpolated value for the start of the sample
- Calculating an interpolated value for the end of the sample
- Drawing a line between each value in the sample (including the interpolated values)
- Calculating the area below the line
- Dividing the result of the area calculation by the duration of the sample. The result of this step is the time average for the sample.

To calculate the time average, Geo SCADA Expert uses the raw historic values in the resample interval and also a value for the start time and end time of the resample interval. If there is no raw historic value for the start time or end time, Geo SCADA Expert calculates anInterpolated value and uses that for the start/end time value.
Geo SCADA Expert then draws a line between the raw historic values (and interpolated values) and calculates the area of the space below the line. It then divides the area amount by the duration of the sample. The result is the time average value for the sample and it has a timestamp that matches the start time of the sample (in this case, 15:00).
Using the values in the table (above), an Average value for 15:00-15:01 would be 21.65. A Time Average value for the same period would be 21.53, as the calculation considers how long the point has had a value during the resample interval. In this case, the point had a value of 21.65 for half of the resample interval, and so the Time Average value of 21.53 is closer to that value (than the Average value for the same resample interval).