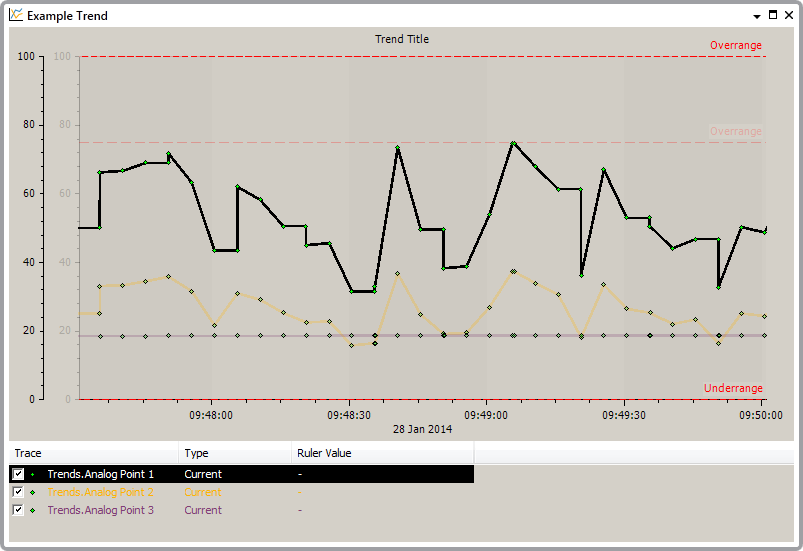
Trends are graphical displays that plot the values of database points and time profiles. They allow you to view and compare the values of points over a specific period of time. Trends are particularly useful when you are looking for patterns in the data, for example, you could use a Trend to compare the values of three different points over a 12-hour period.

Trends allow you to view values over a specific time period, with each value on the Trend representing a point value. Trends can be user-created in the database, generated automatically by Geo SCADA Expert, or user-created and stored as an independent file. For more information, see Pre-Configured Trends and Ad Hoc Trends. For information about the features of the Trend display, see Understanding the Trend Display.
Geo SCADA Expert also supports special types of Trend, in the form of X-Y Plots and X-Y-Z Plots. These have a similar appearance to Trends, but have different purposes:
- X-Y Plots are designed for monitoring the historic values of related points. Each plotted value consists of two values - one taken from one point and the other from a different point. For more information on X-Y Plots, see Understanding X-Y Plots.
- X-Y-Z Plots are designed for comparing the relationship between multiple sets of historic values. Each X-Y-Z Plot provides a 'three-dimensional' ('3D') graphical representation of sets of historic values, with the z-axis providing the 'depth', in the form of a time line. For more information on X-Y-Z Plots, see Understand X-Y-Z Plots.