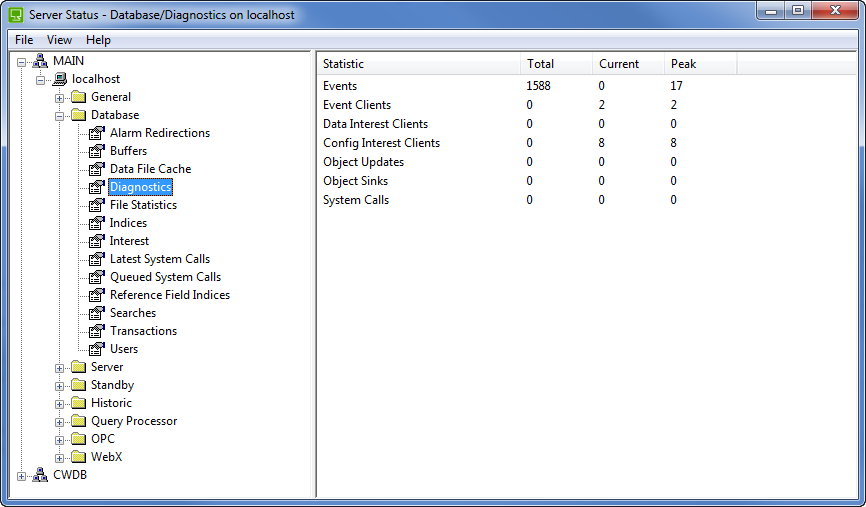
The Diagnostics category provides statistical information about system activity. You can use this information to investigate the amount of system traffic.

The traffic status information is shown in rows, with each row representing a different type of Statistic. The rows are:
- Events—The Events row shows the Total number of events that have occurred in the database, the Current number of events being processed, and the highest number of events that have been processed simultaneously (the Peak number of events).
- Event Clients—The Event Clients row shows the Total number of clients that receive events from the server. It also shows the Current number of clients that are receiving events, and the highest number of clients that have been receiving events at the same time (the Peak number of events).
- Data Interest Clients—The Data Interest Clients row shows the Total number of clients that receive interest references from the server (for more information on interest, see Interest). It also shows the Current number of clients that are receiving interest references, and the highest number of clients that have received interest references at the same time (the Peak number of events).
- Config Interest Clients—The Config Interest Clients row shows the Total number of clients that are receiving configuration data from the server. It also shows the Current number of clients that are receiving configuration data, and the highest number of clients that have received configuration data at the same time (the Peak number of events).
- Object Updates—Shows the Total number of items that have been updated via a client connection, the Current number of items being updated via a client connection, and the highest number of items that have been updated via a client connection at a single time (the Peak number of updates).
- Object Sinks—The Object Sinks row shows the Total number of client connections that are used for updates, the Current number of client connections that are being used for updates, and the highest number of client connections that have been used for updates at a single time (the Peak number of object sinks).
- The server uses an object sink to transfer the updates to the clients. This information can be used by Schneider Electric software engineers to determine the cause of unexpected performance and update issues.
- System Calls—The System Calls row shows the Total number of clients that have received a system call (a command to run an .exe file) from the server. It also shows the Current number of clients that are receiving system calls, and the highest number of clients that have received system calls at the same time (the Peak number of events).
- For more information on system calls, see System Calls Settings in the ClearSCADA Guide to Server Administration.