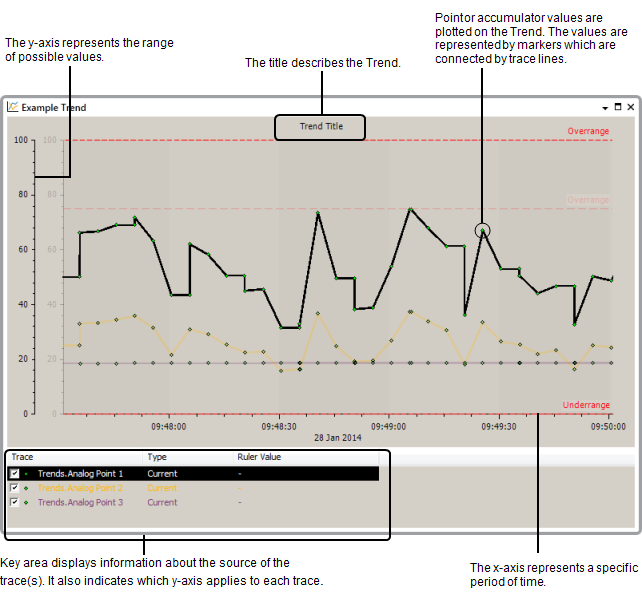
The Trend Window consists of:
It may also contain Trend Alarm Limits and Trend Annotations.

Each Trend has an X-Axis that represents time and one or more Y-Axes that represent the range of possible data values. When points or master station accumulators are plotted on a Trend, their values are represented by markers which are connected by a trace. The trace can be a line, outlined bar, filled bar or stepped line. You can configure a Trend to display one or more traces simultaneously.