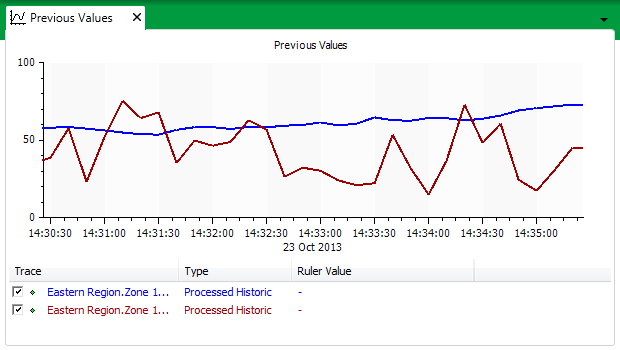
Trends are graphical displays that plot the values of database items. They allow you to view and compare the values of points over a specific period of time.

Trends display data with the x-axis representing time, and the y-axis representing data values. Trends can be configured to display multiple traces simultaneously.
Geo SCADA Expert supports several types of Trend:
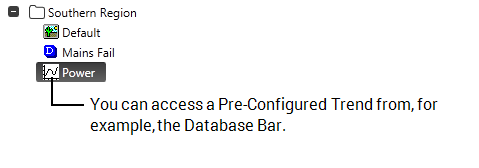
- Pre-Configured Trends—These are system-specific Trends that have been configured by high level users as part of your Geo SCADA Expert database configuration. They appear as Trend items in your database, enabling you to access them in the same way as other items such as Mimics:

Pre-Configured Trends can display multiple traces and may combine current and historic data on the one Trend.
- Ad Hoc Trends—’Standard’ Ad Hoc Trends are not stored in your database, rather they are generated when you display them. You can display a ‘standard’ Ad Hoc Trend for any point or master station accumulator in your database, by selecting the relevant option from the point or accumulator’s context-sensitive menu (see Object Menu Options). Geo SCADA Expert supports two types of ‘standard’ Ad Hoc Trend:
- Current—Displays the current data values for the point or accumulator.
- Historic—Displays the raw or processed historic data for the point or accumulator. This type of Ad Hoc Trend is only available if Historic logging is enabled on the point or accumulator. (Raw data is the source data, whereas processed data comprises the values that result from Geo SCADA Expert performing calculations on the raw data to, for example, adjust the values to a more usable range.)
High level users can configure ‘custom’ Ad Hoc Trends as part of your Geo SCADA Expert database configuration. You typically display ‘Custom’ Ad Hoc Trends via hyperlinks on Mimics. You can also store links to ‘custom’ Ad Hoc Trends in your Favorites list.
Higher level users can also access Ad Hoc Trends for specific items or properties from the OPC Data Bar or OPC Historic Data Bar. For more information, see Working with the OPC Data Bar, and see Working with the OPC Historic Data Bar.
Higher level users can also access Ad Hoc Trends for specific items or properties from the OPC Data Bar or OPC Historic Data Bar. For more information, see Working with the OPC Data Bar, and see Working with the OPC Historic Data Bar.
For more information on using Trends, see the Geo SCADA Expert Guide to Trends.
Geo SCADA Expert also supports special types of Trends, such as X-Y Plots, and X-Y-Z Plots. For more information, see the Geo SCADA Expert Guide to X-Y Plots, and the Geo SCADA Expert Guide to X-Y-Z Plots.