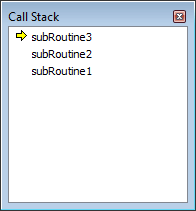
While you are debugging a script, you can use the Call Stack window to:
- display the current script execution path
-
locate a selected stack frame within a script.
To display the Call Stack window:
- Enable Debug Mode to display the Script tab on the ViewX ribbon.
- Select the Call Stack command in the View group.

The Call Stack window is displayed.

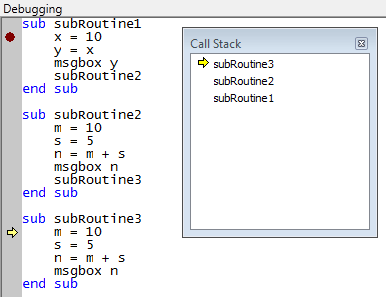
The Call Stack window indicates the execution path by displaying the stack frames associated with the current execution location. A yellow arrow indicates the frame that contains the current execution location.
Within the script, a yellow arrow also indicates the current execution location.

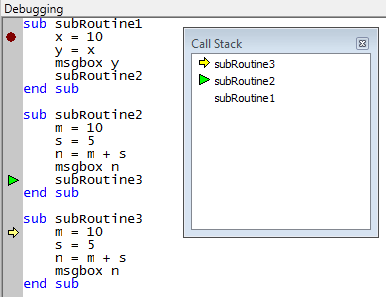
- To change the selected stack frame within the script, double-click on the required frame within the Call Stack window.
A green arrow appears to indicate the selected stack frame. A matching green arrow also appears at the return location within the script.

If the current execution location is within the selected frame, only the yellow arrow appears.
You can use the Call Stack window with the Variables window while debugging a script. When you select a frame in the Call Stack window, the variables included in the frame appear in the Variables window(see View and Edit Variables while Debugging).