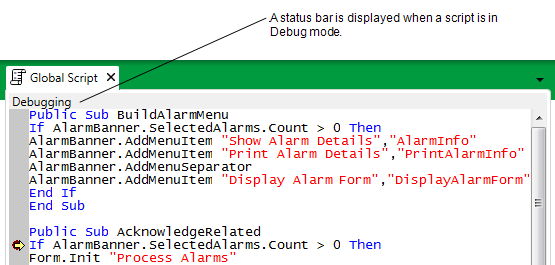
You can use Debug mode to access the various debugging options. Debug mode is enabled when you:
- Display a Mimic in Run mode (see Run Mode and Design Mode in the Geo SCADA Expert Guide to Mimics).
- Select Debug Mode in the View command group on the Graphics tab.
Or:
- Display a Mimic in Design mode.
- Select Edit Script in the View command group on the Graphics tab.
- Deselect the Design Mode button
 on the Quick Access Toolbar.
Or:
- Display the Script Editor for a Mimic.
- Deselect the Design Mode button
 on the Quick Access Toolbar.
Or:
- Display an Alarm Banner script (see Display the Global Script Editor).
- Select Debug Mode in the Debug command group on the Script tab.
While in Debug Mode, the ViewX ribbon displays the Script tab. The Script tab includes debugging options in the Debug, Breakpoints and View command groups.
The Debug group contains commands that allow you to Debug a Script.
- Debug Mode—Activates and deactivates the debugger. When the debugger is deactivated, the Script tab is not available.
- Stop—Ends the debugging session.
- Break—Use to interrupt a script that is running and put the script into debug mode. This is useful if a script is taking a long time to run or is unable to complete.
- Continue—Proceeds with the script from the breakpoint onwards.
- Step Over—Performs the current line then proceeds to the next line.
- Step Into—Enters a function that is within the script.
- Step Out—Performs the current function then exits to the call level of the script.
- Run to Cursor—Performs the script up to the line at which the cursor is positioned.
- Set Next Statement—Skips to the statement that is on the line that you select. The lines of script between the previous statement and the selected statement are ignored.
- Show Next Statement—Moves the cursor to the next statement in the script.
The Breakpoints group contains commands that allow you to use breakpoints while debugging (see Debug a Script).
- Insert/Remove—Adds or removes a breakpoint at the selected line. You need to place the cursor at the required line before selecting this option.
- Remove All—Deletes each of the breakpoints in the script.
- Edit—Displays the Breakpoints window which you can use to add a breakpoint, change the line number of a breakpoint, remove a breakpoint, and jump to the line of script on which the breakpoint is used.
- Enable/Disable—Activates or deactivates the selected breakpoint. This is useful when testing the script as it allows you to keep a breakpoint in the script even though it is to be inactive for one run of the script. The breakpoint can then be enabled for the next run.
- Disable All—Disables each of the breakpoints in the script. The breakpoints remain in their positions but are not active.
- Show Next Statement—Moves the cursor to the next statement in the script.
The View group contains commands that display additional debugging tools.
- Variables—Displays the Variables window (see View and Edit Variables while Debugging).
- Call Stack—Displays the Call Stack window (see Display the Current Script Execution Path).
The debugger operates in one of three states:
- Running—Debug mode is enabled, and script is currently executing.
- Debugging—Debug mode is enabled, and script is currently paused.
- Not Running—Debug mode is enabled, but no script is executing.
The current state is displayed on a status bar that appears at the top of a script while it is in Debug mode.
