When you first add a trace to a Trend, it uses the default settings that have been configured for your system (see Define the Default Settings for New Trends). You can edit the trace so that it uses settings and that meet your requirements.
The properties shown in the Edit Trace window vary, depending on the type of data that the trace represents.
To edit a trace:
- Right-click on the name of the trace in the Trend key.
A context-sensitive menu is displayed. -
Select the Edit... option.
The Edit Trace window is displayed.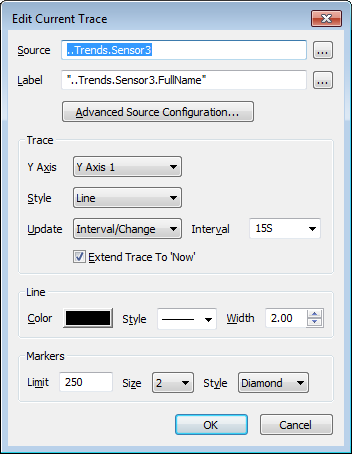
Use the following fields to define the Current trace:
Source
Use this field to enter or use the browse button to select the point that provides the data for the trace. If you have used drag and drop functionality to add a trace to the Trend, the Source field will show the name of the item that you dragged onto the Trend.
If you want to change the source or select a source for the first time, you can either enter the location of the point in the Source field or use the Browse button feature to select the required point tag. You can choose to use a relative or absolute reference to the tag by selecting or clearing the Relative check box on the Select Tag browse window (see Relative and Absolute References).
LabelUse the Label field to define the text string that is used to represent the trace in the Key. It is the FullName property of the database item associated with the trace by default, but you can change it if required.
As the Label is an expression, you need to enclose the Label entry within single straight quotation marks ' '.
Advanced Source ConfigurationUse the Advanced Source Configuration button to access the Edit Source window. You can use the Edit Source window to define advanced settings for the data source. The options on the Edit Source window vary according to the type of data represented by the trace.
When you select the Advanced Source Configuration button, the Edit Source window is displayed.
The properties shown in the Edit Source window vary, depending on the type of data that the trace represents.
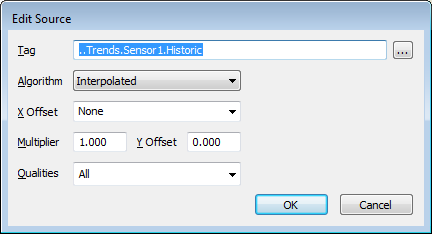
Use the Edit Source window to define the source settings:
TagThe entry in this field represents the property tag of the source of the trace. You can alter the tag by overwriting the entry in the Tag field or by using the browse button feature to locate and select a different property tag in the hierarchy.
AlgorithmThis field is only available for Processed Historic traces. Use the combo box to define the algorithm type that is used to process the source’s historic data. For more information on the various algorithms, see Built-In Historic Algorithms for Processed Historic Data.
If the trace Interval is set to Per Pixel, only the following options are available in the Algorithm combo box—Average, Average Interpolated, Average Last, Interpolated, Max, Max Interpolated, Max Last, Min, Min Interpolated, Min Last.
Take care with End and End Last Historic Algorithms used on clients, or with Geo SCADA Expert features, that run in Local Time with Daylight Saving Time. Ensure that the start and end times specified for the sample interval do not coincide exactly with the time at which the clock jumps backward. Include a small offset in the sample time, to offset the calculation to avoid the sample end or start time exactly matching the time that the clock jumps backward at the transition from Daylight Saving Time to Standard Time. A small offset of 1s or even 1ms should suffice. For more information about Daylight Saving Time, see The Effects of Daylight Saving Time Adjustments.
X OffsetThis field is only available for Processed Historic and Raw Historic traces. Use the combo box to define a time offset for the trace. This is useful when there are multiple traces on a Trend. You can use the offset to set different time scales so that you can compare values over time. For example you could have a Trend that show one trace’s value for the current hour and another trace’s values value for the previous hour.
You can choose from any of the time periods provided in the combo box or you can overwrite the combo box entry with your own time interval (see Using OPC Time Formats).
For more information about Processed Historic and Raw Historic data, refer to:
MultiplierAllows you to apply scaling to the trace. Each value that is received from the server is multiplied by the Multiplier amount and then the Y Offset (below) is added to provide the scaled value. This is useful when value scaling is required.
Y OffsetDefines the position of the trace on the Y-Axis. This feature allows multiple traces to be displayed closer to each other on the Y-Axis for comparison purposes. The Y Offset value is added to each value that is received from the server for this particular trace so that the values appear higher or lower on the Y-Axis as required.
QualitiesThis field is only available for Processed Historic and Raw Historic traces. Use the field to specify whether the trace is to show values of Good quality only, Bad quality only, Uncertain quality only, or All qualities.
Using the Qualities setting can be useful when you want to exclude values of a certain quality type. For example, you may want your trace to only represent those values that were recognized as being reliable (Good quality).
If you have outstations that have the Log Historic Value on Communication Failure setting enabled, we recommend that you exclude Bad quality data from your historic Trends. This is because the Log Historic Value on Communication Failure setting creates an extra Bad quality value in the event of a loss of communications. This ‘extra’ value can create undesirable results when viewing historic data. For more information, see Quality Filter for Historic Views.
For further information on Quality, see Quality.
Extended Source FilterThis field is only available for a Raw Historic trace, for which the Source database point is configured to store Put Aside data historically (see Store Put Aside Values Historically). 'Put Aside' data is the 'live' data that is 'put aside' in favor of locally overridden data while a local Override is in force. Use the combo box to specify whether the trace is to display Raw historic data (the default), or Put Aside historic data.
When you have defined the Advanced Source Configuration settings, select the OK button to close the Edit Source window and return to the Edit Trace window.
Use the Trace section to define the appearance of the trace:
Y-AxisUse this field to choose which of the Y-Axes applies to the trace. If your Trend only has one Y-Axis, you will only be able to select Left which is the default Y-Axis on the left-hand side of the Trend. If you add another Y-Axis, you will be able to select any of the extra Y-Axes instead of the left Y-Axis.
StyleUse this field to define the type of trace. You can choose from:
- Line—The trace is drawn as a line between the values.
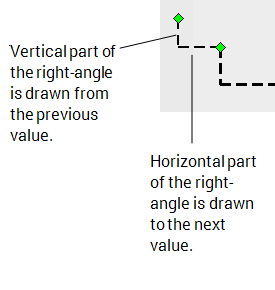
- Step First—The trace is drawn so that there is a right-angle between the values. The vertical part of the right-angle is drawn from the previous value, and the horizontal part indicates the next value (and contains the marker if markers are shown).
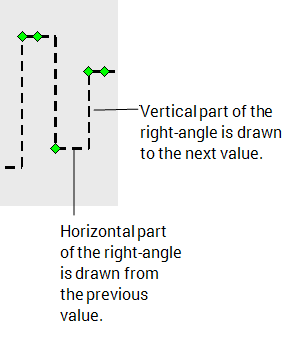
- Step Last—The trace is drawn so that there is a right-angle between the values. The horizontal part of the right-angle is drawn from the previous value, and the vertical part indicates the next value (and contains the marker if markers are shown).
- Bar—The trace is drawn as a bar (not filled).

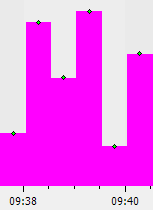
- Filled Bar—The trace is drawn as a bar and is filled in.
Gap DetectThis combo box is only available for historic traces with a Line or Step First or Step Last style. Use the Gap Detect combo box to define the amount of time that is acceptable for a gap in the data. The trace will be interrupted by the gap if the Gap Detect setting is less than the amount of time for which the gap has occurred. If the Gap Detect setting is greater than the time span of the gap, the trace will be continuous (uninterrupted by the gap in the data).
Example:If the server is offline for ten minutes, then there will be a ten minute gap in the data where no values were retrieved or calculated.
If the Gap Detect setting is less than 10M, there is a break in the trace between the data before the ten-minute gap and the data that follows the gap when the server returns to an online state.
If the Gap Detect setting is greater than 10M, then the a line is drawn between the data before the gap and the data after the gap so that the missing values are treated as part of the trace (and the trace is uninterrupted).
Bar WidthThis combo box is only available when the trace Style is set to 'Bar' or 'Filled Bar'. Use the combo box to define the amount of time that can be covered by a single bar. The Width setting cannot be greater than the Interval.
IntervalUse to define the amount of time between each value that is shown on the trace. You can choose from any of the time periods provided in the combo box or you can overwrite the combo box entry with your own time interval.
Processed Historic traces have a Per Pixel option which allows Geo SCADA Expert to determine the Interval automatically (it will use the time period represented by each pixel of the X-Axis to calculate the interval). This option generates smoother Trend traces, but many of the Algorithm options listed above are not available in this mode.
Raw OverlayThis check box is only available for Processed Historic traces that have Interval set to Per Pixel. When you select the check box, the raw historic values are shown as markers on the trace in addition to the processed historic values (that the trace represents). If you clear the check box, the markers for the raw historic values are hidden.
For more information on processed historic traces, see Processed Historic Data on Trends.
Extend Trace to ‘Now’Use to define whether the trace is extended to the current time on the Trend (when the trace values are not plotted up to the current time).
If you select the Extend Trace to ‘Now’ check box, the trace is extended so that the last reported value is the value used from the time of the last reported value up to the current time.
If you clear the Extend Trace to ‘Now’ check box, the trace is not extended—the trace line ends at the time that corresponds to the last value.
If the Interval is set to Per Pixel, the trace may be extended even if you clear the Extend to ‘Now’ check box, as the server may use the current time as part of its calculation, for example, with interpolated algorithms.
Point LimitThis field is only available for Raw Historic traces. Use the field to define the maximum number of values that can be shown on a Trend.
The Point Limit helps to reduce the load on the server as it means a Trend can only use a set number of values. If a trace requires more values than the defined Point Limit, the Trend will show no values for the trace.
Traces that require an excessive number of values place a high demand on server resources and can cause slow performance. By setting a point limit, you instruct Geo SCADA Expert to only draw the trace if it has a reasonable amount of values. As a result, this means that traces with excessive numbers of values are not drawn and so do not affect performance.
The default Limit of 2500 is usually suitable for most systems, but you may need to alter the setting if there are Trends that have high numbers of values (in many cases, Trends with many values for a specific time period).
If a trace has a high number of values and the Trend is slow and less responsive than expected, operators may choose to change the time scale on the X-Axis. Changing the time scale by using the Zoom tool means that there will be fewer values shown on the trace, and so it will place less demand on the server).
For more information on raw historic data, see Raw Historic Data on Trends.
UpdateThis field is only available on Current traces. Use the combo box to define when the trace is updated. Choose from:
On IntervalThe trace updates at the end of the interval period using the value of the data source at that time. Any changes to the value that occur during the interval period are not displayed.
On ChangeThe trace updates whenever the value of the data source changes.
Interval / ChangeUpdates the trace whenever the value of the data source changes as well as at the end of the interval period.
IntervalThis field is only available on Current traces for which the Update is set to On Interval, or Interval/Change. Use the combo box to specify the required interval.
Define the appearance of the trace by using the Line settings
 Color
ColorUse the Color button to define the color of the trace. Choose a color from the color palette or select the ... option on the color palette and use the Color window to create a custom color (see The Color Palette Window).
StyleUse the Style combo box to define the appearance of the trace line. The line can be a solid line or a dashed line (there are several types of dashed line).
WidthUse the Width spin box to define the thickness of the trace line (this is only available for Line, Step First and Step Last trace styles). You can specify a line width of between 1 and 72 inclusive.
Use the Markers settings to define the appearance of the markers that indicate the reported or calculated values:
 Limit
LimitDefine the maximum number of markers that can be shown on a trace. The markers indicate each value. If the number of markers requested by the Trend exceeds the markers Limit, the markers are not shown. This is useful as it allows you to control the maximum number of markers that can be shown on a trace—an excessive amount of markers can result in the trace being less effective as it is difficult for operators to distinguish between the values.
Typically, the default setting of 250 is adequate, but you may need to increase the Limit if your Trends are not showing any markers (because they require more markers than are permitted by the Limit). However, you may need to reduce the Limit if your Trends are difficult to use because they contain too many markers.
SizeDefine the size of the markers. You can choose a size from 1 to 5, where size 1 is the smallest and size 5 is the largest. You should choose the size that is suitable for the trace. For example, smaller marker sizes are recommended for traces that contain a high number of markers, as large markers can make traces appear cluttered, especially when there are a high number of values on display.
StyleDefine the shape of the markers that are shown on the trace. You can choose from Diamond, Square, or Cross shapes.
With a Raw Historic or Processed Historic trace, use the fields within the Annotations section to define the appearance of any annotation markers on the trace:
 Size
SizeUse the combo box to define the size of the annotation markers. You can choose a size from 1 (the smallest size) to 5 (the largest size). The default is 3.
StyleUse this combo box to define the shape of the annotation markers. The options are Square, Diamond, or Cross.
- Select the OK button to confirm your choices and close the Edit Trace window.
Your Trend will display with the settings you selected. - Save the configuration.
Specify the width of trace lines on 'standard' ad hoc Trends that are displayed in Virtual ViewX: see Define the Trace Settings of 'Standard' Ad Hoc Trends on Original WebX.