You can position the traces on an X-Y-Z Plot manually or automatically.
You can use a trace's ToolTip to check its current position (see View Information about a Particular Trace).
You can define a trace's Position as an expression, rather than a static value (see Specify the Trace's Position). If you use one of the procedures listed below to reposition such a trace, that trace's position will revert to a static value. The value will indicate the fixed position to which the trace has been moved.
To position a trace manually, either:
- Display the X-Y-Z Plot in Design mode (see Display an X-Y-Z Plot in Design Mode).
- Position the cursor over the x-axis tick that represents the trace.
- Drag the trace to the required position along the x-axis.
- Select the Save button to store the change to the X-Y-Z Plot.
Or:
- Display the X-Y-Z Plot in Design mode (see Display an X-Y-Z Plot in Design Mode).
- Display the Properties window for the trace (see Configure a Trace).
- Specify the required position in the window's Position field (see Specify the Trace's Position).
- Select the Save button to store the change to the X-Y-Z Plot.
If more than one trace is included on an X-Y-Z Plot, and the x-axis is displayed in its entirety (rather than zoomed in), you can position the traces manually (see above) or automatically. To position the traces automatically, either:
- Display the X-Y-Z Plot in Design mode (see Display an X-Y-Z Plot in Design Mode).
- Click on a blank area of the X-Y-Z Plot.
- Press the spacebar on the keyboard.
Geo SCADA Expert positions the traces equally along the x-axis. - Select the Save button to store the change to the X-Y-Z Plot.
Or:
- Display the X-Y-Z Plot in Design mode (see Display an X-Y-Z Plot in Design Mode).
- Right-click on a part of the x-axis that does not contain a tick.
A context-sensitive menu is displayed. - Select the Arrange Traces option.
A further context-sensitive menu is displayed.The Arrange Traces option is only available on an X-Y-Z Plot that contains more than one trace and for which the x-axis is displayed in its entirety (rather than zoomed in). If required, Reset the Zoom Level to display the x-axis in its entirety and gain access to the Arrange Traces option.
- Perform one of the following:
- Select the Equally Spaced option.
Geo SCADA Expert positions the traces equally along the x-axis. - Select the Save button to store the change to the X-Y-Z Plot.
Or:
- Select the Shrink to Left option.
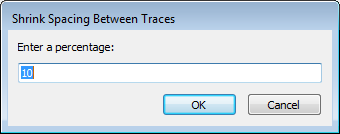
The Shrink Spacing Between Traces window is displayed.
- Enter the percentage by which you want Geo SCADA Expert to reduce the spacing between the traces and then press OK.
Geo SCADA Expert reduces the distance between each trace by the specified percentage. In doing so, the traces are positioned further to the left side of the x-axis. This includes the position of the left-most trace, unless that trace was already at the left-hand end of the x-axis. (See the worked example below.) - Select the Save button to store the change to the X-Y-Z Plot.
Or:
- Select the Shrink to Right option.
The Shrink Spacing Between Traces window is displayed.
- Enter the percentage by which you want Geo SCADA Expert to reduce the spacing between the traces and then press OK.
Geo SCADA Expert reduces the distance between each trace by the specified percentage. In doing so, the traces are positioned further to the right side of the x-axis. This includes the position of the right-most trace, unless that trace was already at the right-hand end of the x-axis. (See the worked example below.) - Select the Save button to store the change to the X-Y-Z Plot.
- Select the Equally Spaced option.
Example:
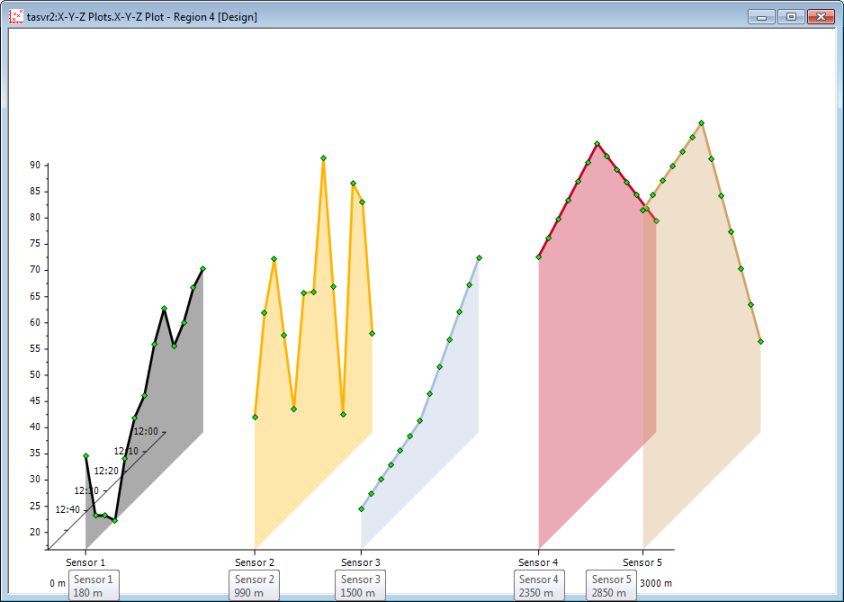
An X-Y-Z Plot contains 5 traces on an x-axis that is configured to represent a span of 0 to 3000m. The traces are spaced along the x-axis at the positions shown by the ToolTips. (Multiple ToolTips are included on these figures purely to demonstrate the trace's positions - in reality, you can only display one ToolTip at a time.)

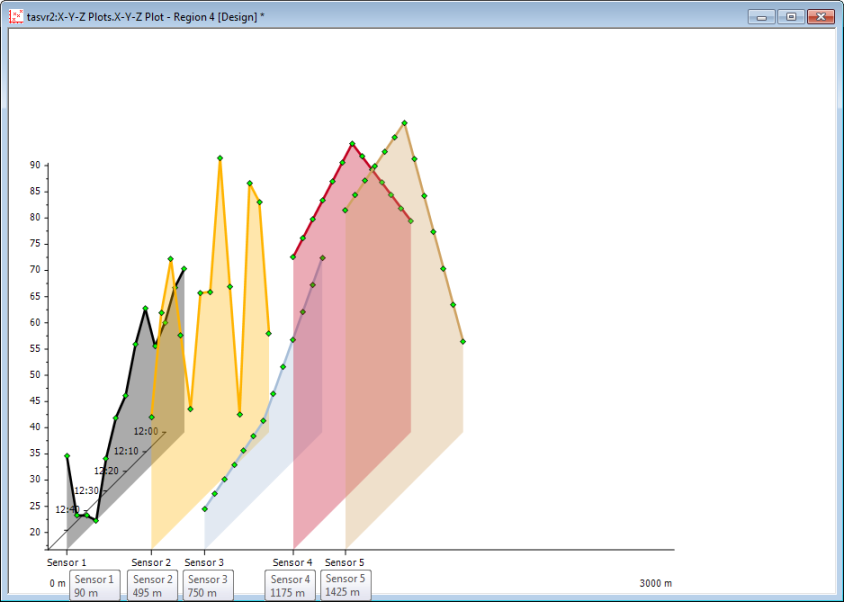
The Shrink to Left option is used to shrink the traces' positions to the left by 50%. This option reduces the distance between each trace's position and the start of the x-axis. So, for example, the trace that was located 180m along the x-axis is repositioned to 90m, as 90m is 50% of the distance between the trace's original position and the start of the x-axis (50% x 180 = 90). Similarly, the trace that was located at 990m along the x-axis is repositioned to 495m (as 50% x 990 = 495), and so on. The ToolTips shown below indicate the updated positions of the 5 traces.

Example:
>An X-Y-Z Plot contains 5 traces on an x-axis that is configured to represent a span of 0 to 3000m. The traces are spaced along the x-axis at the positions shown by the ToolTips. (Multiple ToolTips are included on these figures purely to demonstrate the trace's positions - in reality, you can only display one ToolTip at a time.)

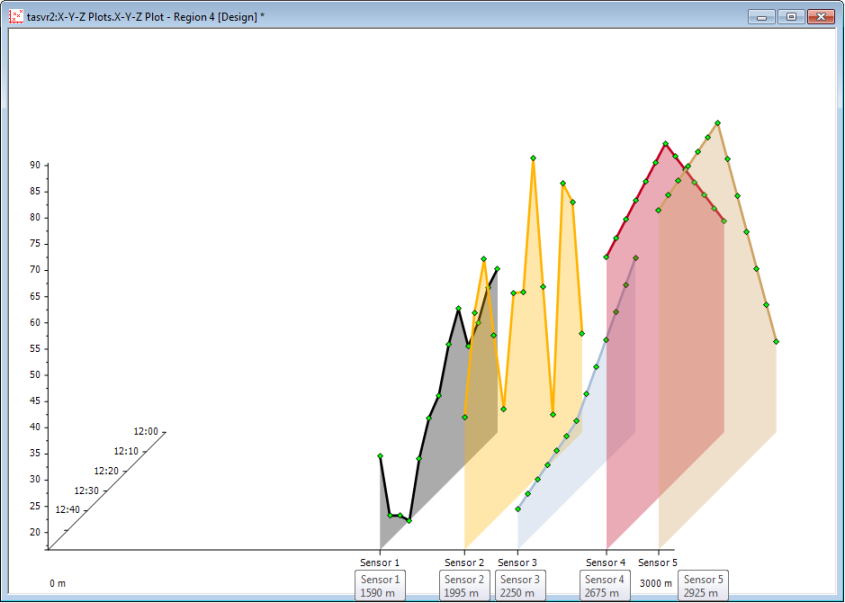
The Shrink to Right option is used to shrink the traces' positions to the right by 50%. This option reduces the distance between each trace's position and the end of the x-axis. So, for example, the trace that was located 2850m along the x-axis is repositioned to 2925m. (The distance between the trace's original position and the end of the x-axis was 150m (as 2850 = 3000 - 150); 50% x 150 = 75, therefore the trace's revised position is 2925 (as 3000 - 75 = 2925). Similarly, the trace that was located at 2350m along the x-axis is repositioned to 2675m (as 2350 = 3000 - 650; 50% x 650 = 325; therefore the revised position is 2675 (as 3000 - 325 = 2675)), and so on. The ToolTips shown below indicate the revised positions of the 5 traces.
