A Control System can be configured to consist of multiple nodes, (see Define the Node Name for a Client - System Connection). Keeping track of state is important for the engineers when diagnosing problems. The System Status window allows you to see the state of each of the nodes and diagnose any issues.
You require System Admin permission be able to diagnose issues, (see Allocating Security Permissions).
To view the System Status from the ViewX client and manage the server nodes in the system:
- Select the Home tab on the ViewX ribbon.
- Select the Status command on the ribbon.

Or:
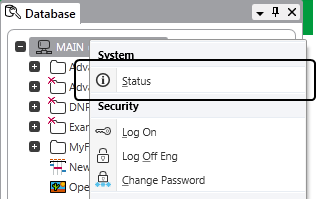
- Display the Database Bar (see Display an Explorer Bar).
- Right-click on the System Node
A context-sensitive menu is displayed. - Select the Status option.

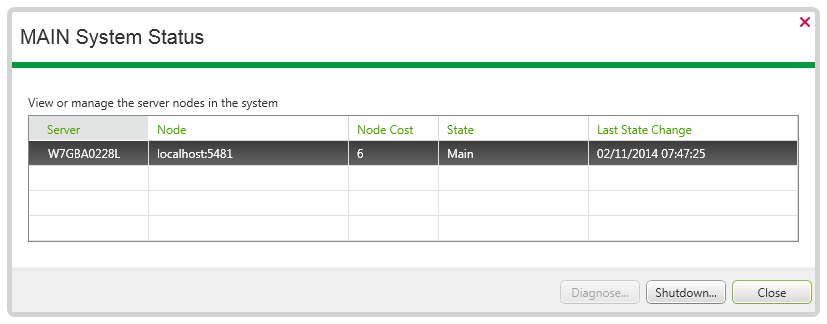
The System Status window is displayed:

For each Server node in the system the following information is displayed:
- Server—The Server column displays the node’s Server label as configured in the Servers Partner area, (see Define the System Name and Type for a ViewX Client - System Connection).
- If the server is currently offline, but a previous connection has been made to the server, then its last known name (cached) is displayed.
- If the Server label has never been retrieved before, then the node’s internal name is used 'Node A', 'Node B', 'Node C', 'Node D'. This corresponds to the client configuration, (see Define the Node Name for a Client - System Connection).
- Node—The Node column displays the node name in the format of <Name> : <Port>,
- Node Cost—The Node Cost column displays the cost associated with the node, (see Define the Node Cost for a Client - System Connection)
The Node and Node Cost columns are only displayed for users that have the System Admin permission on the root group, (see Allocating Security Permissions).
- State—The status of each node is continuously updated. When a state change occurs the State column is updated immediately. When a server’s state is indicated as Configuration Problem a warning icon
 will appear in the Server column to the left of the name.
 - Last State Change—The Last State Change indicates the date and time that the state column was updated.
Selecting a server in the list activates the Shutdown and Diagnose buttons. By default the first server in the list is selected.
The Shutdown and Diagnose buttons are only available for users that have the System Admin permission on the root group, (see Allocating Security Permissions).