You can use the Server Status branch of the OPC Data Bar as an alternative means of accessing a selection of the properties that are available from the Server Status Tool. The properties relate to the ClearSCADA server to which the ViewX client is currently connected.
To view information about server status properties in any of the above categories:
- Display the OPC Data Bar (see Display an Explorer Bar in ViewX in the ClearSCADA Guide to ViewX and WebX Clients).
- Expand the Server Status branch of the system for which you want to view information.

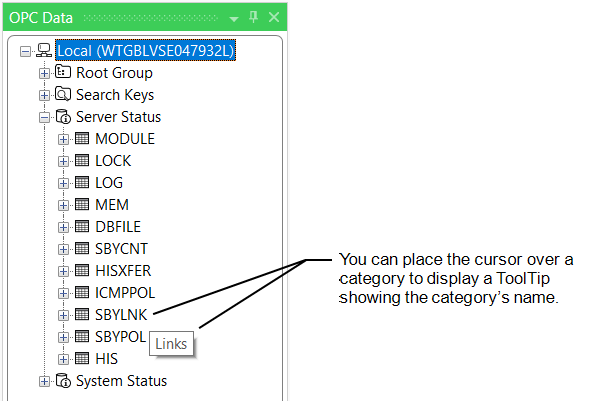
- The Server Status categories that are available from the OPC Data Bar include:
- MODULE—Equivalent to the Server Status Tool’s Modules category
- LOG—Equivalent to the Server Status Tool’s Logging category
- MEM—Equivalent to the Server Status Tool’s Memory Usage category
- DBFILE—Equivalent to the Server Status Tool’s File Statistics category
- HIS—Equivalent to the Server Status Tool’s Historian category
and the following categories, which relate to Main-Standby performance:
- SBYCNT—Equivalent to the Server Status Tool’s Counters category
- HISXFER—Equivalent to the Server Status Tool’s Historic Transfer category
- ICMPPOL—Equivalent to the Server Status Tool’s ICMP Polls category
- SBYLNK—Equivalent to the Server Status Tool’s Links (Standby) category
- SBYPOL—Equivalent to the Server Status Tool’s Polls category.
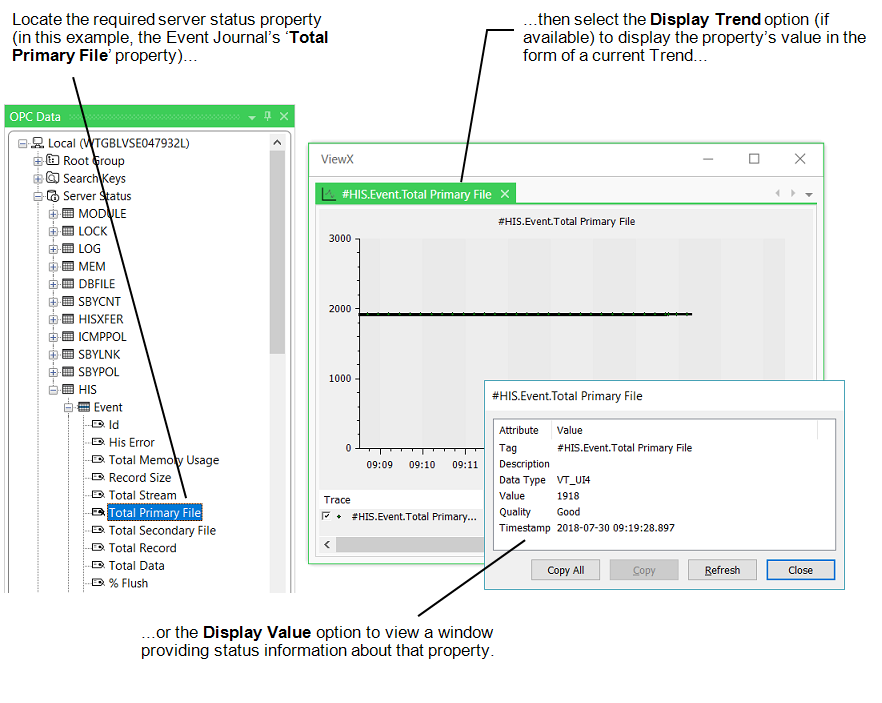
- Expand the tree structure of the required category, including any subcategory within that category, to locate the property in which you are interested.
Either:
- Double-click on the property to display a window providing information about that property.
Or:
- Right-click on the property.
A context sensitive menu is displayed. - Either:
- Select the Display Value option to display a window providing information about that property.
Or:
- Select the Display Trend option to display the property’s value in the form of a current Trend. (This option is only available for some properties.)
ClearSCADA supports several types of Trend. The type of Trend that you can display using the OPC Data Bar is a ‘standard’ Ad Hoc Trend (see Pre-Configured Trends and Ad Hoc Trends).

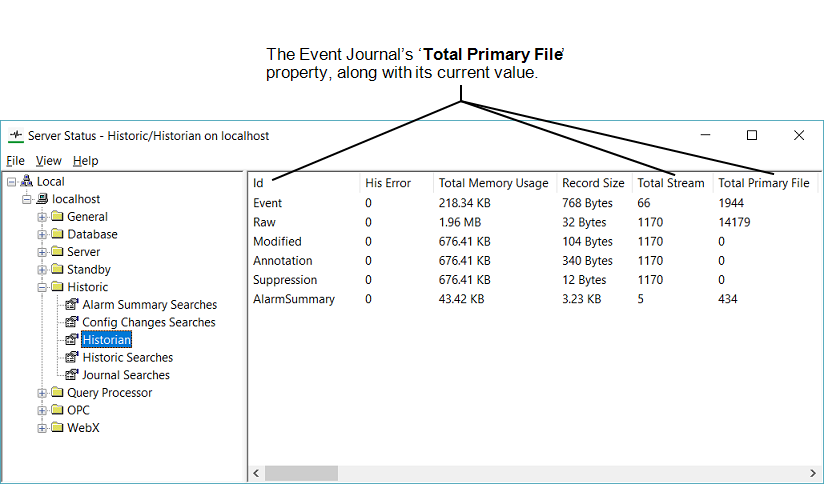
The property’s current value can also be accessed using the Server Status Tool:

You can also use the Server Status branch of the OPC Data Bar to ascertain the name of a server status property, in order to use that property elsewhere (for example, in a Logic program or on a Mimic). The name of each property is stored in the database in the form of an OPC Tag.
If required, you can either:
- Copy and paste the OPC Tag from the window that is displayed when you double-click on the property or select Display Value from the property’s context sensitive menu. For more information, see Use the Status Display Buttons in the ClearSCADA Guide to ViewX and WebX Clients.
- Drag the required property (OPC Tag) from the OPC Data Bar onto a Mimic or other display. For more information, see Add Live Values to a Mimic in the ClearSCADA Guide to Mimics.