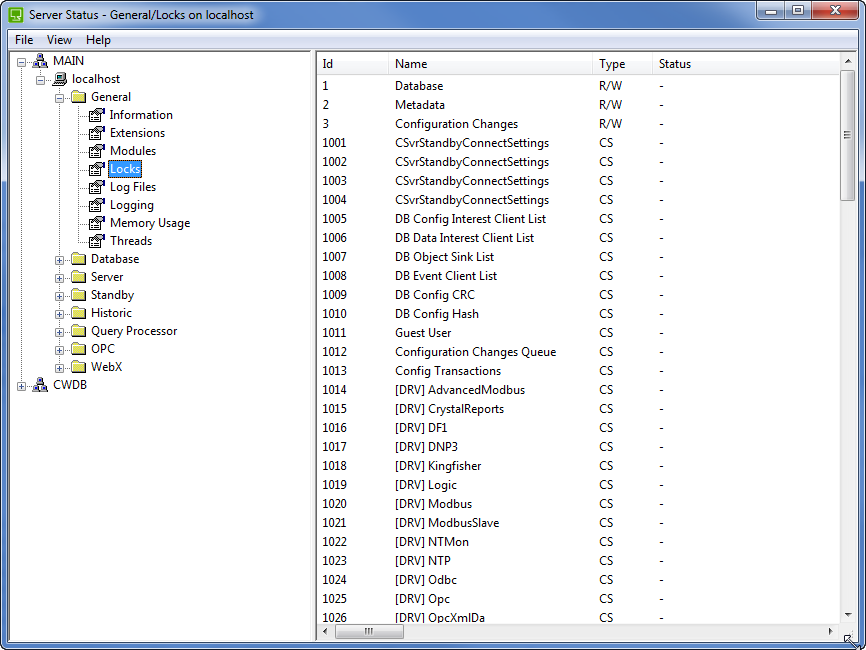
Welcome to the ClearSCADA Guide to Server Status. This Guide explains how to access and use the Server Status Tool.
Intended Audience
This guide is designed to be used by server administrators and maintenance engineers who are responsible for diagnosing unexpected conditions on your ClearSCADA system.
Document Scope
This guide explains how to use the Server Status Tool to monitor your system and access statistics for diagnosis.
Designed to provide you with accurate system statistics, the Server Status Tool can be used to diagnose unexpected occurrences on your system. You can access the Server Status Tool on any ClearSCADA server.

If you are unfamiliar with the Server Status Tool, we recommend you refer to the following sections:
- System Analysis
- Working with the Server Status Tool
- Run the Server Status Tool
- Overview of the Server Status Tool
- Save a Snapshot of the Status Data Currently on Display
- Define when the Server Status Tool is Updated.
You should also familiarize yourself with Log Files and Log File Settings (see Logging and Monitoring in the ClearSCADA Guide to Server Administration).
If you are familiar with the Server Status Tool, you may prefer to skip the above sections and refer to information about a specific group of categories or an individual category:
- General—Please refer to General System Status Information
- Database—Please refer to Database Status Information
- Server—Please refer to Server Status Information
- Standby—Please refer to Standby Status Information
- Historic—Please refer to Historic Status Information
- Query Processor—Please refer to Query Processor Status Information
- OPC—Please refer to OPC Status Information
- Web—Please refer to WebX Status Information