Specify the Total Lock Time per Minute Alarm
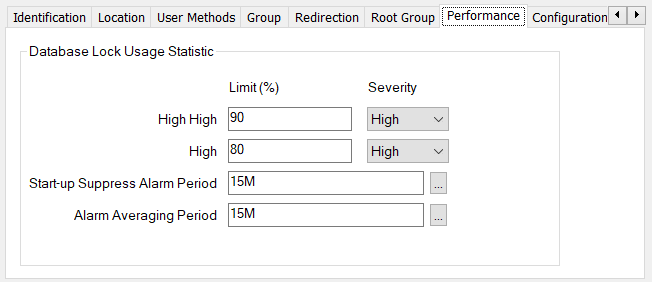
The Performance tab on the System or Root Group includes a Database Lock Usage Statistic section.
Use the section to configure the alarm settings that are to apply when the last minute's average of total lock usage exceeds configurable thresholds.

Use this field to define the percentage total lock time that needs to occur to raise a High High Warning alarm. The default setting is 90%.
Use this combo box to define the severity of the High High Warning alarm. For more information on severities, see Defining Severities.
Use this field to define the percentage total lock time that needs to occur to raise a High Warning alarm. The default setting is 80%.
Use this combo box to define the severity of the High Warning Alarm. For more information on severities, see Defining Severities.
When the server starts up there is a lot of activity related to the database, which would cause Lock Usage alarm thresholds to be exceeded and alarms generated. Use this field to define a period at start-up when these alarms are suppressed. The default setting is 15 minutes.
Use this field to specify the period, in minutes, over which the average Lock Usage must persist above a limit for an alarm to be raised. The default setting is 15 minutes.
The value that you specify in this field helps to reduce the number of 'false positives' by controlling when the Lock Usage Statistic is to raise an alarm. Only if the average Lock Usage Statistic value across the 'Alarm Averaging Period' exceeds the High or High High limits is an alarm raised.
This field is only displayed if the Area of Interest feature is enabled on your system. Use the field to specify the Area of Interest with which the item's alarms and events are to be associated (see Assign a Different Area of Interest to an Item's Alarms and Events). For further information about the Area of Interest feature, see Restrict Alarm and Event Access to Specific Areas of Interest.
In addition to an alarm appearing in the Alarm Banner, a warning appears in the Server Status General Information window, see General Status - Information.
WARNING - Database Lock Usage High-High over 15 minutes, 92.34 % (at '18-MAY-2020 14:26:15.737', 87.62 %).
Please examine system activity in the Performance pages.
Information about database lock usage is also shown in the Server icon ToolTip (see The Server Icon).