This example demonstrates how you might use a ‘standard’ ad hoc Trend as the basis for defining a ‘custom’ ad hoc Trend.
Example:
A ‘custom’ ad hoc Trend is required to enable users to display processed historic data for three sensors, named Sensor 11, Sensor 12 and Sensor 13. Rather than write a new TrendSpec definition from the beginning, the definition is to be based on that for one of the sensor’s ‘standard’ ad hoc Trends.
The Display Historic Trend pick action is used to display Sensor 11’s ‘standard’ historic ad hoc Trend.
To change the ad hoc Trend’s display mode from ‘Run’ to ‘Design’ use the Design Mode button.
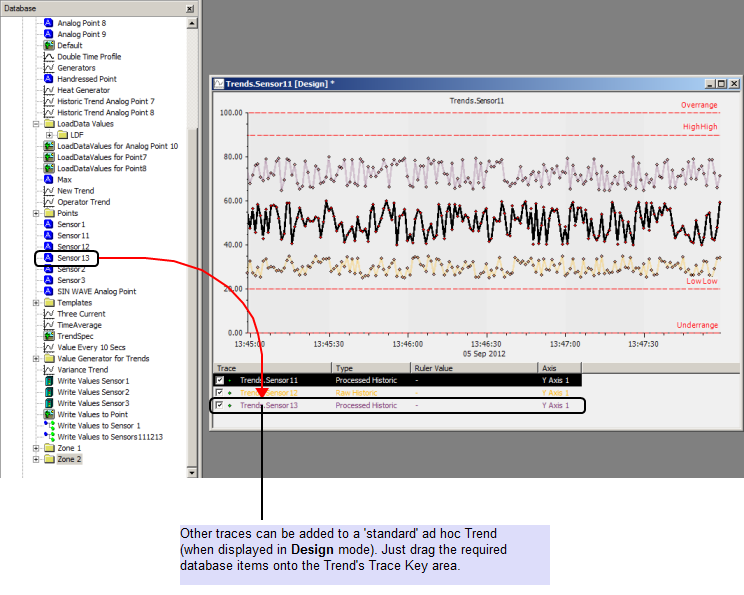
Traces for the other sensors are added to the Trend. This is done by selecting each sensor’s entry in the Database Bar, then dragging the selection onto the trace key in the Trend window.
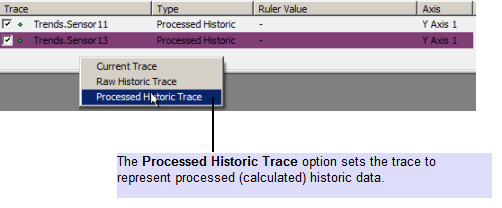
As each entry is dragged into the trace key area, a context sensitive menu is displayed. In each case, the Processed Historic Trace option is selected.
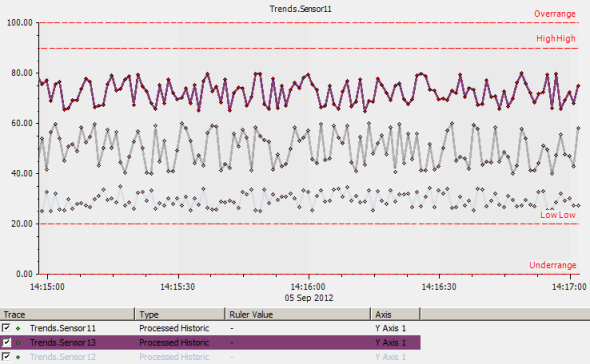
This results in the three traces being displayed on the ad hoc Trend:
Select the Edit tab on the ViewX ribbon.Select the Copy Shortcut option to paste the ad hoc Trend’s definition into the clipboard.
The content of the clipboard is then pasted into Notepad.
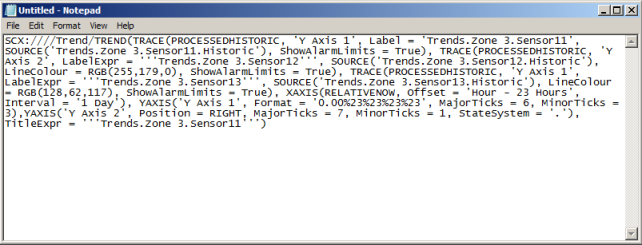
The content is adjusted as required. In this particular case, line breaks are used to separate the various sections of the ad hoc Trend’s definition:
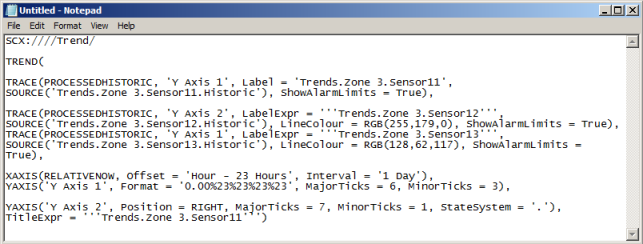
Minor modifications are made to the definition. For example, the Label identifier for the first trace is replaced with an appropriate LabelExpr expression. Similarly, the Trend’s TitleExpr identifier is replaced with a Title identifier. (The TitleExpr derives its value from the ad hoc Trend’s original data source—the sensor from which the Trend was originally accessed.)
Although the ad hoc Trend’s definition contains three TRACE sections, it only contains two YAXIS sections. This is because two of the sensors, Sensor 11 and Sensor 13, have the same point value range (0 to 100) and can therefore be assigned the same Y-Axis (‘Y Axis 1’). Sensor 12 has a different point value range (0 to 120), so is assigned a different Y-Axis for that range. To make this association clearer, a Colour identifier is added to the YAXIS section for ‘Y Axis 2’. The Colour identifier is allocated the same color as that used for Sensor 12’s trace.
The ‘custom’ ad hoc Trend is to be accessed via a button on a Mimic. Script is to be used to display the Trend whenever the button is selected.
Scripting is enabled on the relevant Mimic (see Enable the Scripting Feature on a Mimic).
The basic script structure is entered into the Mimic’s Script Editor. The ad hoc Trend’s definition is then pasted from Notepad into the script subroutine.
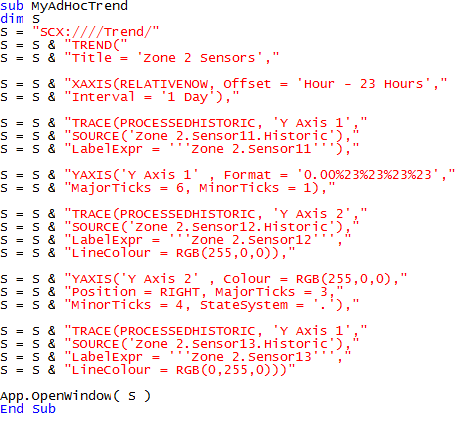
The Mimic is saved.
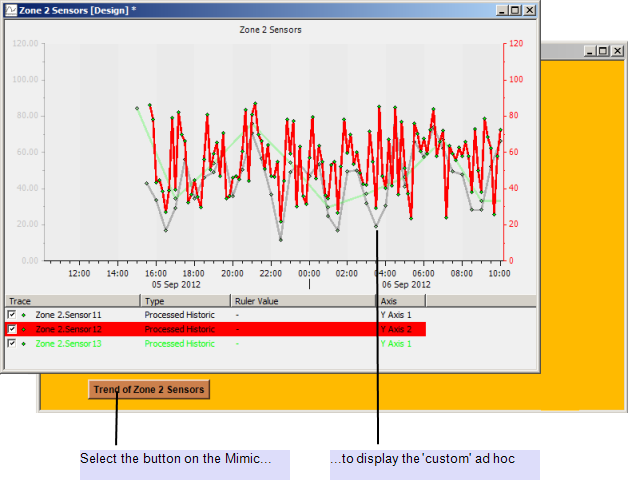
Users can display the ‘custom’ ad hoc Trend at any time, by selecting the relevant button on the Mimic.
Further Information