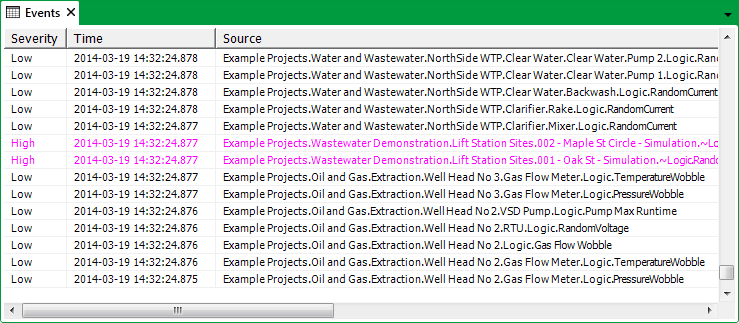
You can display a list of events that have occurred on a single ClearSCADA system (database). The List is pre-filtered by time—the period for which events are initially shown is defined by your User Account (or the Guest User Account if you are not logged on to ClearSCADA).
Any events that relate to alarms are displayed in the same color scheme as used on the Alarms List (see The Color of Entries in a List other than the Alarms List).
Be aware that your user account settings, security permissions and so on, may restrict the events to which you have access. This is to help ensure that you are only made aware of events that might be of interest to you.
To display a general list of events on a ViewX client, either:
- Select the Home tab on the ViewX ribbon.
- Select the Events command from the relevant command group.
Or:
- Press the F10 function key.
An Events List is displayed. The List shows event messages that have been logged on your system within a specified time period (the Event List Range specified on your User Account (or the Guest User Account if you are not logged onto ClearSCADA)).

If the Events List is not displayed and a Historic Cache message is shown, there are too many events for the query to process. To avoid this, you may need to further filter the Events List (see Filter a List). (If the filter does not resolve the situation, contact a high-level user as the amount of memory available may be inadequate, or the configuration of database items may mean that events are being logged more often than are actually required.)
You can refresh the Events List by selecting the Refresh Query option from the List's context-sensitive menu or by pressing F5 (see Refresh the Data on a List other than an Alarms List).
LOSS OF DATA
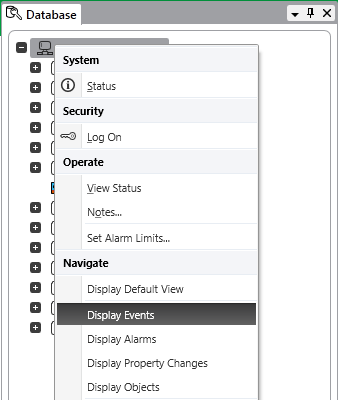
On a ViewX client that has access to multiple ClearSCADA databases, the above procedures each display the general Events List for the default ClearSCADA database. To display the Events List for a particular ClearSCADA database to which a ViewX client has access:
- Display the Database Bar (see Display an Explorer Bar).
- Right-click on the relevant system entry.
A context-sensitive menu is displayed.
- Select the Display Events option.
The list of events for that ClearSCADA system is displayed.
You can also display a general list of events for the ClearSCADA database to which a WebX client is connected (see View and Action Events on a WebX Client in the ClearSCADA Guide to ViewX and WebX Clients).