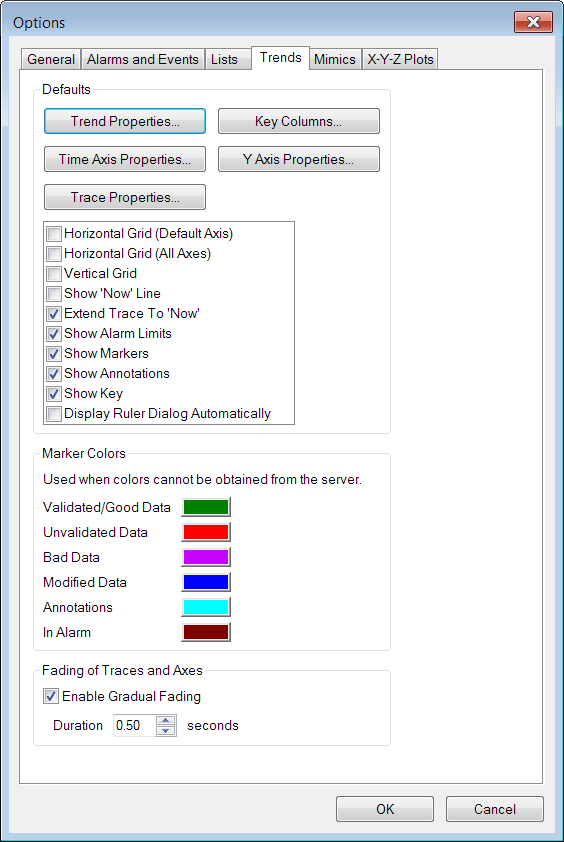
You can use the Options window to define the default settings for Trends. These settings, which include marker colors, columns, and number of axes, will be applied to new Trends automatically. By defining the default settings for Trends, you may be able to reduce the amount of configuration required (depending on whether your Trends are to have similar settings).
To access the Options window, you have to log on to your system via a User account that has the Configure Options feature enabled.
To change the default settings for your Trends:
- Display the Options window.
-
Select the Trends tab. This tab contains the settings you can apply to new Trends by default.

Trend Properties
Use this button to display the Trend Properties window. You can use this window to define the default:
- Title
- Color (Title)
- Font settings for the Main, Title,Label, and Key sections of a Trend. The Font settings include Family, Height, Bold, and Italic.
- Background Color
- Alarm Limit Labels
These settings work in a similar way to the settings that are available when you edit a Trend (see Configure the Display Settings for a Trend). The only difference is that these settings are applied to new Trends automatically.
Key Columns
Use this button to access the Select Columns window. You can use the Select Columns window to choose which columns are shown on a Trend’s key by default.
The Select Columns window works in the same way as when you edit the columns for an individual Trend (see Define the Columns on the Key). The only differences are that the default settings are applied automatically to all new Trends that you create, and you cannot choose custom columns for the default settings. This is because custom columns, when used, are applied to a specific trace and so cannot be applied to all Trends (some Trends will not contain the specific trace).
X Axis Properties
Use this button to access the Edit X Axis window. The Edit X Axis window works in the same way as when you edit the X-Axis on an individual Trend (see Configure the X-Axis). The only difference is that the default settings you define are applied automatically to all new Trends that you create.
Y Axis Properties
Use this button to access the Edit Y Axis window. The Edit Y Axis window works in the same way as when you edit the Y-Axis on an individual Trend (see Configure a Y-Axis). The only difference is that the default settings you define are applied automatically to all new Trends that you create.
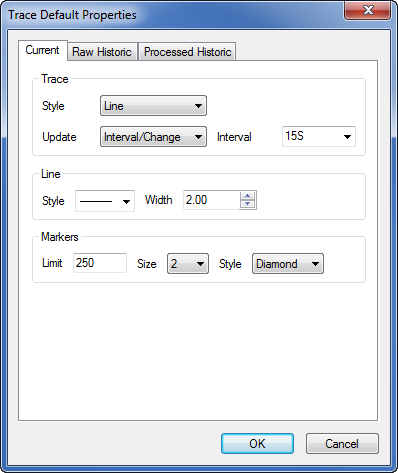
Trace Properties
Use the button to access the Trace Default Properties window. You can use this window to define the default settings for Current, Raw Historic and Processed Historic types of trace.

The Trace Default Properties window has settings that work in a similar way to those found on the Edit Trace window (see Configure a Trace). The difference is that the settings on the Trace Default Properties window define the default settings for new Trends.
There are three tabs of settings, one for each type of trace. For example, if you want to define the default settings for processed historic traces, you need to use the settings on the Processed Historic tab.
Use the check boxes in the Defaults section to define whether certain display settings are shown or hidden. Select the check box to show the setting or clear it to hide the setting:
Horizontal Grid (Default Axis)Defines whether grid lines are shown for the ticks on the default Y-Axis. If you add another Y-Axis to the Trend, the new Y-Axis will only display horizontal grid lines if the Horizontal Grid (All Axis) check box is selected.
Horizontal Grid (All Axis)Defines whether grid lines are shown for the ticks on any Y-Axes that you add to a Trend. The default Y-Axis only will have horizontal grid lines if the Horizontal Grid (Default Axis) check box is selected and the Horizontal Grid (All Axis) check box is clear.
Vertical GridDefines whether vertical grid lines are shown for the ticks on the X-Axis for new Trends.
Show ‘Now’ LineDefines whether a vertical line that indicates the values for the current time (now) is shown on new Trends.
Extend Trace to ‘Now’Defines whether the trace is extended to the current time on the Trend (when the trace values are not plotted up to the current time).
If you select the Extend Trace to ‘Now’ check box, the trace is extended so that the last reported value is the value used from the time of the last reported value up to the current time. If you clear the check box, the trace is not extended—the trace line ends at the time of the last value.
If the Interval is set to Per Pixel, the trace may be extended even if you clear the Extend Trace to ‘Now’ check box. This is because the server may use the current time as part of its calculation, for example, with Interpolated algorithms.
Show Alarm LimitsDefines whether lines that indicate the alarm thresholds for the traces are shown on new Trends. If you select the Show Alarm Limits check box, the threshold lines are shown on new Trends; if you clear the check box, the lines are not shown.
The Show Alarm Limits option only applies to alarm limits that are constant. If your Trend uses alarm limits that are associated with a Time Profile, the Time Profile alarm limits will vary according to the time of day and will not be affected by the Show Alarm Limits option.
Show MarkersDefines whether markers that indicate the values for the traces are shown on new Trends.
Show AnnotationsDefines whether markers that indicate annotations are shown on new Trends.
Show KeyDefines whether the key is shown on new Trends.
X-AxisDefines the default Offset and Interval for the X-Axis (in time units). For example, if you set the Offset to H, the Trend will display data starting at the beginning of the current hour. If you set the Interval to 1H, the width of the X-Axis will be 1 hour.
Display Ruler Dialog AutomaticallyDefines whether the Ruler dialog is shown. The Ruler dialog is a window that contains point values for the ruler position and six values before and after the ruler position.
If you select this check box, the Ruler dialog will be shown automatically whenever the ruler is enabled on a new Trend. It will be hidden if you clear the check box.
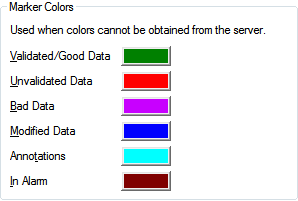
Marker Colors
Use this section to define the default colors for the markers on a trace. The colors that you define in this section are used whenever the Trend cannot obtain the color settings from the server. Typically, this is when the data source for the trace(s) on the Trend is from a non-ClearSCADA database, for example, another OPC database.

You can choose to define the following default marker colors (they are only used if color settings cannot be retrieved from a ClearSCADA server):
Validated/Good DataThe default color of the markers that indicate good quality values (values that are reliably accurate) or values that have been validated by a user (validation only applies when your system has been configured to have the Historic Validation feature enabled via the ClearSCADA Server Configuration Tool - see Historic Configuration Settings). For more information, see Validate Historic Trend Data.
Unvalidated DataThe default color of the markers that indicate a value that has not been validated (this only applies when your system has been configured to have the Historic Validation feature enabled - see Historic Configuration Settings).
Bad DataThe default color of the markers that indicate bad quality values (values that are unreliable and may be inaccurate).
Modified DataThe default color of the markers that indicate a value that has been modified by a user. For more information, see Modify a Value on a Historic Trend, and see Modify a Range of Values.
AnnotationsThe default color of the markers that indicate a user has added an annotation for the value. For more information, see Trend Annotations.
In AlarmThe default color of the markers that indicate a value is in an alarm state.
Fading of Traces and Axes
When you display a trend you can select one of the other traces in the Key. The color of the selected trace will gradually become stronger and the other traces will appear to be faded out. The same effect is applied to the Y-Axes and Alarm Limits (those that apply to the selected trace are shown normally, whereas any other Y-Axes and Alarm Limits are faded out), see Trend Trace.

This section allows you to enable or disable the fading of traces and axes in a trend that is displayed. If you enable the fading of traces you can also define the rate of fade by specifying the duration of time in seconds that it takes for a trace to fade in or out.
You can enter a duration value from 0.0 to 5.0 seconds.
- Select the OK button to confirm your choices and close the Options window. The selections you made will be applied to new Trends automatically as they are created.
Further Information
Specify the width of trace lines on 'standard' ad hoc Trends that are displayed in WebX: see Define the Trace Settings of Standard Ad Hoc Trends on WebX Clients.
Marker colors for data sources that are in the ClearSCADA database, when the marker colors are obtained from the server: see System Colors.