The historic values of a point can be displayed on a Trend (by selecting the Display Historic Trend pick action), or on a Historic List (by selecting the Display Historic List pick action).
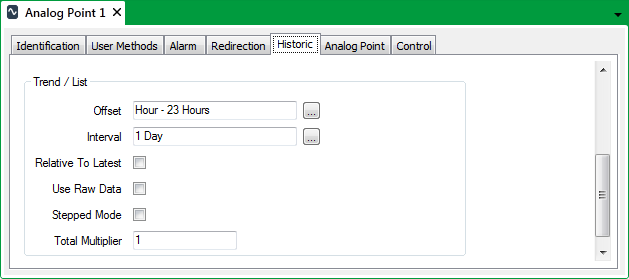
Use the properties within the Trend/List section of the Point Form’s Historic tab to define which time period of data is included on Historic Trends and Lists by default. Also use the section to specify any processing that ClearSCADA is to undertake when presenting the data as a Historic Trend.
To define the above properties for a point:
- Display the Point Form for the point that you want to configure (see Display a Form in the ClearSCADA Guide to Core Configuration).
- Select the Historic tab.
The Historic tab is only included on the relevant configuration Forms when the Historic Data feature is enabled on the server. The feature enables ClearSCADA to store data historically (see Historic Data Storage Settings).
- Ensure that Historic is enabled (see Enable or Disable Historic Data Storage).
ATTENTION: With points on some drivers, ‘Historic Data Filter’ properties are used to define the type of reported point data that ClearSCADA is to store historically for those points. With such points, reported point values are only stored historically if historic is enabled on the point’s Historic tab, and at least one option other than ‘None’ is selected within the Historic Data Filter section of the Point Form. The driver-specific guides provide details about any points that have Historic Data Filter properties.
- Specify the start time of the Historic Trend/List in the Offset field.
Enter the required offset in the OPC Relative Time Format. You can enter the value directly in the field, or use the Offset window (accessed via the field's browse button) to specify the required value.

The Historic Trend or Historic List will only show historic values that were logged after the start time defined by the Offset.
- Specify the amount of time shown on the Historic Trend/List in the Interval field.
Enter the required interval in the OPC Time Format. You can enter the value directly in the field, or use the Interval window (accessed via the field's browse button) to specify the required value.
For the Historic Trend, the Interval is the amount of time shown on the X-Axis.
For the Historic List, the Interval is the amount of time shown on the List. For example, an Interval of 1H means that the List only displays one hour’s worth of historic data.
Example:
For this example, we will assume the current time is 11:30.
A point is configured with these settings:
Offset: H-23H
Interval: 1DThe Display Historic Trend option is used to display the Historic Trend for the point.
The Historic Trend displays the historic values of the point between 12:00 yesterday and 12:00 today. As now is 11:30, the x-axis interval begins at 12:00 yesterday, as the offset and interval settings result in the latest time shown on the axis being rounded forward to the nearest hour.
- Select the Relative to Latest check box if the x-axis of a Historic Trend is to be relative to the latest data that is used in the Trend.
Clear the Relative to Latest check box if the x-axis is to be relative to the current time.
- Select the Use Raw Data check box if the trace on a Historic Trend is to display raw input data for the point. Raw data comprises the actual data values, as reported or read from the device that the point represents.
Clear the Use Raw Data check box if the trace is to display processed point data. This is the default for historic Trends. Processed data comprises the result of calculations on the raw data, either to produce interpolated data (to obtain readings between the raw values), or to calculate the average of a number of raw data values.
Processed data offers maximum flexibility for the Trend. For example, when displaying a large time scale, such as a year, each screen pixel might represent several raw data values. With a processed Trend, ClearSCADA calculates the average value of those raw values and displays a processed or summary value for each pixel.
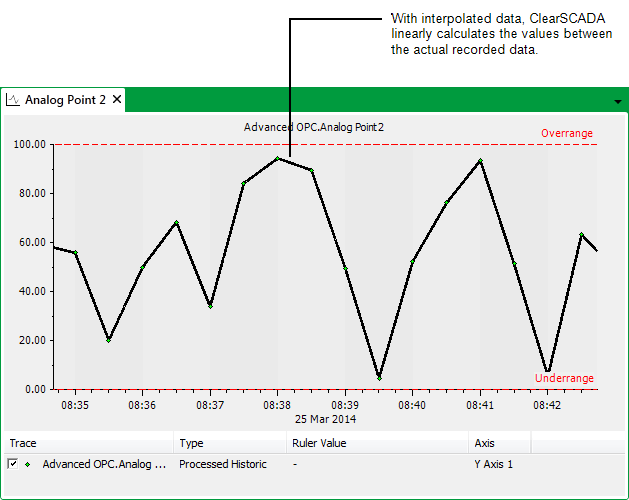
When zooming in to display a very small time scale on a Trend, such as 60 seconds, only a few raw data values might be visible at such a scale. With a trace that uses processed data, ClearSCADA will linearly interpolate between the raw values, to produce a trace that includes both interpolated (calculated) values as well as the actual values that were reported or read from plant.
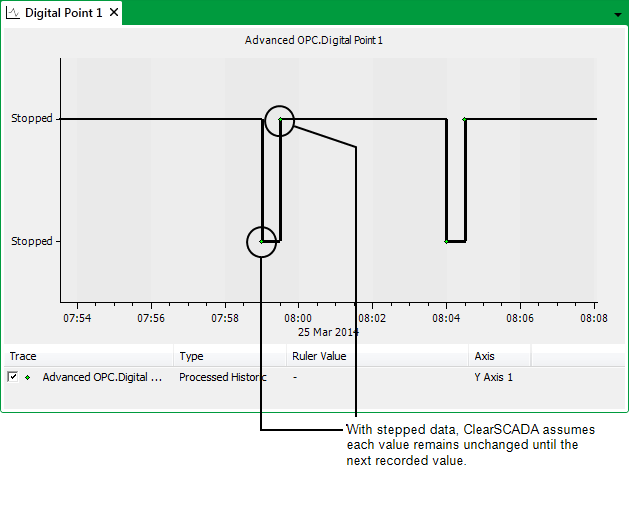
- Use the Stepped Mode check box to specify whether Trends and data calculations linearly interpolate (calculate) between the actual data values.
Leave the check box clear (the default for analog- and counter-type points) for the data to be linearly interpolated.

Select the check box (the default for digital-type points) for the data to be stepped.

- Use the Total Multiplier field to specify the amount by which ClearSCADA is to multiply the results of time integrated calculations, such as Total and Time Average. (Total and Time Average calculations integrate the sample data over time. They can be used, for instance, to convert flow rates into total delivered quantities.)
The Total Multiplier can be used to correct the scale of totalized values, should those values be calculated from raw data values that represent quantity transferred within a time unit.
Use a Total Multiplier of 1 if the time base is in seconds.
Example:
On a particular ClearSCADA system, an analog point is used to measure dosing rate in liters per minute. A Total Multiplier of 0.0166666 (1 divided by 60) is used to scale the result of the Total and Time Average calculations to liters.
- Save the configuration.
To define the time period that is shown on a current Trend, see Define an Analog Point’s Trend Settings, or see Define a Digital Point’s Trend Settings, as applicable.