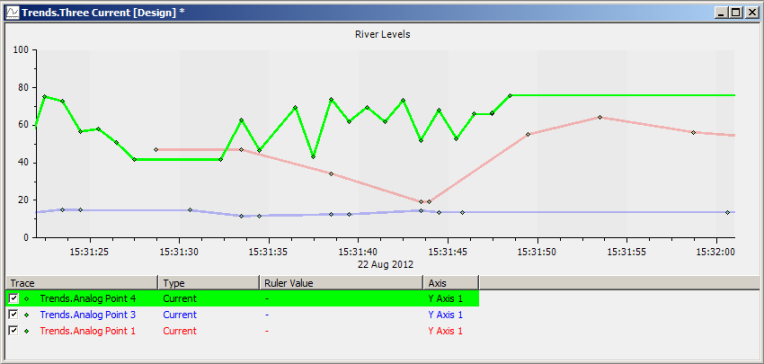
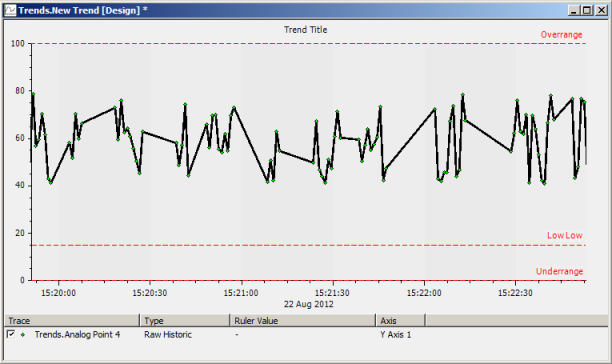
You can configure a Trend to show one or more traces. Each trace represents the values for a single source, which can be a point, a forecast, or a time profile. There are three types of trace:
- Current Trace—Represents the current values of a data source such as a point or a time profile. These are useful for viewing an item’s values over a specific time span and also for comparing the values of multiple items (you can use multiple traces to represent different items on a Trend).
A Trend that shows current data can display data from the time that the trace was configured up to the current time. For example, if you configured the trace at 10.00 and the current time is 10.30, the trace will represent the values for the 30 minute period between 10.00 and 10.30.
- Raw Historic Trace—Represents the historic values that were reported for a data source such as a point (see Raw Historic Data on Trends). No scaling or other calculation is performed on the values for use in ClearSCADA. This option is only available if the data source has historic logging enabled in its configuration and there is historic data in the database.
- Processed Historic Trace—Represents the ‘processed’ values for a data source such as a point (see Processed Historic Data on Trends). Processed values are produced by performing calculations on the raw historic values, typically to convert the values to a more useful scale. This option is only available if the source item has historic logging enabled in its configuration and there is historic data in the database.
To add a trace to a Trend:
- Display a Trend in Design Mode.

The Trend display consists of the Trend area and the key (see Understanding the Trend Display). The Trend area is where the trace is shown. By default, a new Trend displays two axes (X and Y) and a Title. Extra Y-Axes can be added if required (see Add a Y-Axis).
The key is displayed below the Trend display area and lists the traces that are shown on the Trend (none by default). It also displays trace values in columns. You can choose which columns you want to display (see Define the Columns on the Key).
- Display the Database Bar (see Display an Explorer Bar).
- In the Database Bar, select the item that is to be the source of a trace on the Trend and drag it onto the Trend.
A context sensitive menu is displayed that allows you to choose which type of data you want the trace to represent:
- Current Trace—The trace will represent the current data of the item.
- Raw Historic Trace—The trace will display the historic values that were reported for the item (that is, without performing any calculations on the values). This option is only available if the item has historic logging enabled and there is historic data in the database.
If you select the Raw Historic Trace option for a database point, a trace representing the point’s historic values is added to the Trend.
If you select the Raw Historic Trace option for a forecast item, a further menu is displayed. It contains options for each forecast that has been configured for the item (1-8) and an All option. Forecast 1 is the next forecast that will be performed when the Set Forecast action is executed. After a Set Forecast, the options are updated so that the forecast that was previously represented by the Forecast 8 option is now represented by the Forecast 7 option, the previous Forecast 7 by the Forecast 6 option and so on. The last forecast to be performed moves to the Forecast 8 option. This means that the Forecast 1 option represents the forecast that will be performed next.
By selecting a single forecast option, you add a single trace to the Trend. The trace represents the historic values for the selected forecast. If you select the All option, multiple traces are added to the Trend (each trace representing one of the forecasts).
If you select the Raw Historic Trace option for a point that has its limits set by a time profile item and is configured to store the limit profiles historically, a further menu is displayed. It contains options for each profile that has been configured for the point (1-8) and an All option. If you select a single profile option, a trace representing the point’s historic values for that profile is added to the Trend. If you select the All option, multiple traces are added to the Trend (each trace representing the point’s values for one of the profiles).
The ability to store limit profiles historically is limited to certain drivers, such as the DNP3 SCADAPack E driver. For more information, please refer to the documentation for the driver(s) on your system.
- Processed Historic Trace—The trace will display the ‘processed’ historic values for the item. Processed values are produced by performing calculations on the raw historic values, typically to convert the values to a more useful scale. This option is only available if the item has historic logging enabled and there is historic data in the database.
As with the Raw Historic Trace option, there is an additional sub-menu if you are using the Trend to display Forecasts or data for a point that has its limits set by a Profile. The Forecast, Profile and All options work in the same way as with the Raw Historic Trace option - the only difference is that they apply to processed historic data instead of raw historic data.
The context sensitive menu is only displayed if the item has historic and/or processed historic data available. If the item only has current data available, the trace is automatically configured to represent the current data and the context sensitive menu is not displayed.
When you have selected one of the options, the trace is added to the Trend. It uses the default configuration settings for a trace (see Define the Default Settings for New Trends).
When you have selected one of the options, the trace is added to the Trend. It uses the default configuration settings for a trace.

- Save the configuration.
When you have added a trace, you can configure it as required (see Configure a Trace).
There are also other ways of adding a trace to a Trend:
- Right-click on the key or on the Trend area, then select the Add Trace option and use the Add Trace window to select the item.
Or:
- Display the OPC Data Bar (see Display an Explorer Bar in ViewX in the ClearSCADA Guide to ViewX and WebX Clients).
- Expand the OPC tree structure to locate the item that you want to have displayed on the Trend. Click on the item to expand and display its contents.
The item’s OPC tags are shown. - Drag the tag you require onto the Trend (typically, you would drag the CurrentValue tag, but you can add any tag to the Trend).
This technique only allows you to create a Current Trace.
Or:
- Display the OPC Historic Data Bar (see Display an Explorer Bar in ViewX in the ClearSCADA Guide to ViewX and WebX Clients).
- Expand the OPC tree structure to locate the item that you want to have displayed on the Trend.
- Drag the appropriate historic aggregate tag for the item onto the Trend. Many items only have a single historic aggregate tag, and so you only need to drag the item icon onto the Trend. However, some items such as Forecasts have multiple historic aggregate tags which you can view by expanding the item in the OPC Historic Data Bar. You can then drag each historic aggregate tag onto the Trend as required.
A context sensitive menu is displayed. - Select either Raw Historic or Processed Historic from the context-sensitive menu.